Jadescape Has Logged 78 Resales At A Median Of S$2,349 psf — And Its Highest Quarterly Median Came On Its Thinnest Volume
Published 25 Sept 2026 · Jadescape
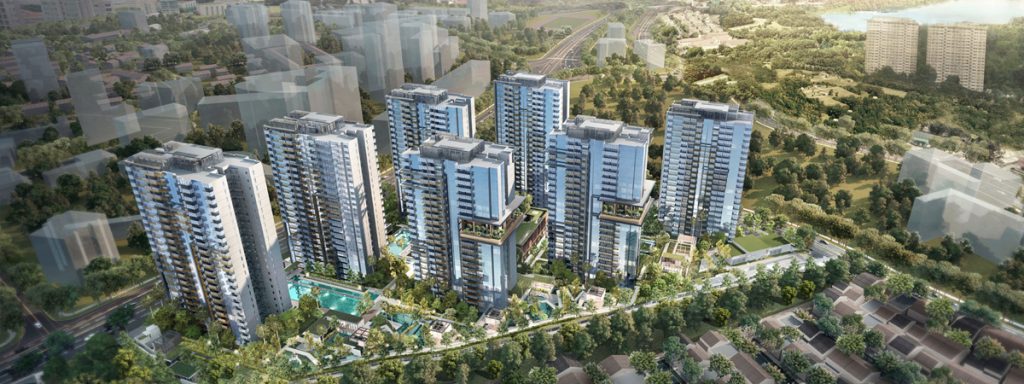
Jadescape has been one of the busier resale addresses in District 20. Seventy-eight resales in four quarters is a lot of activity for a single project. Over the same stretch, the median price per square foot kept drifting up. But the quarterly transaction counts have thinned out as it did. That is the tension we kept returning to while going through the tables. A rising median is easy to quote. A rising median on 13 sales in the latest quarter is a different sort of number, and worth handling with more care.
According to URA Data Service caveats, Jadescape recorded 78 resales over 3Q2025 to 2Q2026, at a median of S$2,349 psf. It is a 99-year leasehold condo with 91 years of lease left. Across the eight quarters shown, the quarterly median moved +12.0%, from S$2,172 psf in 3Q2024 to S$2,434 psf in 2Q2026. The district's resale median over the same four quarters was S$1,986 psf, from 551 sales. Jadescape sits +18.3% against that. Rental approvals in 2Q2026 came to 43 contracts, at a median of S$6.18 psf a month.
The quarterly median has climbed from S$2,172 psf to S$2,434 psf, but not in a straight line
The eight-quarter path is upward, with two pauses. The median dipped in 2Q2025 to S$2,250 psf, after S$2,277 psf in 1Q2025. It dipped again in 1Q2026, to S$2,340 psf from S$2,369 psf. Both dips came in quarters with 15 sales. The larger counts sit earlier in the window. 3Q2024 had 29 sales, 1Q2025 had 30, and 3Q2025 had 28. The last two quarters shown have 15 and 13. So the recent medians rest on a smaller base than the earlier ones. That does not make them wrong. It does mean a handful of unusual units can move the line more than they would have in 2024.
The percentile columns are worth a look on their own. In 2Q2026 the 25th percentile is S$2,159 psf and the 75th is S$2,539 psf. That is the widest gap in the table. In 3Q2024, the same two columns read S$2,082 psf and S$2,251 psf. A spread that wide on 13 sales points to a mixed set of units rather than a single price level. The size bands in the next table show where some of that mix comes from. Read the line chart below with the counts attached, not on its own.
| Quarter | Resales | Median psf | 25th percentile | 75th percentile |
|---|---|---|---|---|
| Q3 2024 | 29 | S$2,172 psf | S$2,082 psf | S$2,251 psf |
| Q4 2024 | 21 | S$2,211 psf | S$2,133 psf | S$2,257 psf |
| Q1 2025 | 30 | S$2,277 psf | S$2,230 psf | S$2,379 psf |
| Q2 2025 | 15 | S$2,250 psf | S$2,135 psf | S$2,411 psf |
| Q3 2025 | 28 | S$2,300 psf | S$2,182 psf | S$2,388 psf |
| Q4 2025 | 22 | S$2,369 psf | S$2,285 psf | S$2,496 psf |
| Q1 2026 | 15 | S$2,340 psf | S$2,248 psf | S$2,503 psf |
| Q2 2026 | 13 | S$2,434 psf | S$2,159 psf | S$2,539 psf |
The most traded size band is not the one printing the highest psf
Over 3Q2025 to 2Q2026, the 70 to 89 sqm band did the heavy lifting. It recorded 32 resales at a median of S$1,789,000, or S$2,331 psf, on a median area of 764 sqft. That is the busiest band by some distance. But it is not the dearest by area. The 90 to 119 sqm band, with 19 resales, posted a median of S$2,541 psf and a median price of S$2,750,000. The smallest units sit at the other end. Under 50 sqm, 14 resales came in at a median of S$1,060,000, or S$2,010 psf.
So psf rises with size up to the 90 to 119 sqm band, then eases. The 120 sqm and above band shows a median of S$2,447 psf, on a median price of S$4,100,000. Two of these bands are thin. The 50 to 69 sqm band has six resales, and the largest band has seven. At those counts, a single storey difference or a particular stack can shift the median. The table below sets out all five bands.
One more thing about the headline median. The project-level figure of S$2,349 psf blends all of this together. It moves with the mix of sizes sold in any given quarter, not only with price.
| Size band | Resales | Median area | Median price | Median psf |
|---|---|---|---|---|
| under 50 sqm | 14 | 527 sqft | S$1,060,000 | S$2,010 psf |
| 50 to 69 sqm | 6 | 646 sqft | S$1,475,944 | S$2,285 psf |
| 70 to 89 sqm | 32 | 764 sqft | S$1,789,000 | S$2,331 psf |
| 90 to 119 sqm | 19 | 1,055 sqft | S$2,750,000 | S$2,541 psf |
| 120 sqm and above | 7 | 1,647 sqft | S$4,100,000 | S$2,447 psf |
Rents have held in a narrow band while the resale median kept rising
The rental approvals from data.gov.sg give a steadier picture. Across the last four quarters, the median rent per square foot a month reads 6.1, 6.1, 6.3 and 6.2. Median monthly rent went S$4,300, then S$4,000, then S$3,900, then back to S$4,000. Contract counts stayed reasonably high throughout, from 56 in 3Q2025 to 38 in 1Q2026, with 43 in 2Q2026. As with the sales medians, the rent median reflects whichever units happened to be leased that quarter. A quarter heavier in smaller units will print a lower monthly rent and a higher psf figure.
Set the 2Q2026 rent median against the resale median, and our engine measures a gross yield of about 3.2%. That is a gross figure from recorded contracts and recorded caveats. It carries no costs, no vacancy and no assumption about any individual unit. It is an indicative measure across the project, not a valuation of any home in it. The table below shows the four quarters of rental contracts.
| Quarter | Contracts | Median rent (S$ psf a month) | Median monthly rent |
|---|---|---|---|
| Q3 2025 | 56 | 6.1 | S$4,300 |
| Q4 2025 | 44 | 6.1 | S$4,000 |
| Q1 2026 | 38 | 6.3 | S$3,900 |
| Q2 2026 | 43 | 6.2 | S$4,000 |
Jadescape prints above every leasehold project within 1 km, and above one freehold one
Within a kilometre, eight projects recorded resales over the same four quarters. The leasehold group sits below Jadescape's S$2,349 psf. Thomson Three, 991 m away, recorded 27 resales at a median of S$2,152 psf. Rafflesia Condominium managed 12 at S$1,605 psf, and Seasons View seven at S$1,529 psf. Lakeview Estate, 520 m away, came in at S$1,045 psf from 11 resales. These are different projects of different ages and sizes, and the table does not hold any of that constant.
The freehold names read differently. Thomson Garden Estate, the closest at 178 m, posted a median of S$3,128 psf from 15 resales. Clover Park reached S$2,721 psf on six, and Yew Lian Park S$2,434 psf on four. Thomson Park sits lower, at S$1,899 psf from four resales. Half of the eight projects have counts in single digits or low teens. Against the wider district, Jadescape is +18.3%, measured against a district median of S$1,986 psf from 551 sales. The neighbour table is below.
| Project | Tenure | TOP | Distance | Resales | Median psf |
|---|---|---|---|---|---|
| Thomson Three | 99-year leasehold | — | 991 m | 27 | S$2,152 psf |
| Thomson Garden Estate | freehold | — | 178 m | 15 | S$3,128 psf |
| Rafflesia Condominium | 99-year leasehold | — | 696 m | 12 | S$1,605 psf |
| Lakeview Estate | 99-year leasehold | — | 520 m | 11 | S$1,045 psf |
| Seasons View | 99-year leasehold | — | 299 m | 7 | S$1,529 psf |
| Clover Park | freehold | — | 611 m | 6 | S$2,721 psf |
| Thomson Park | freehold | — | 613 m | 4 | S$1,899 psf |
| Yew Lian Park | freehold | — | 454 m | 4 | S$2,435 psf |
The top of the price range belongs to the 2,099 sqft units
The five largest resales in the window fall into two areas. Three of them are 2,099 sqft. The highest was S$5,050,000 in 3Q2025, from the 21-25 storey range, at S$2,406 psf. A 11-15 storey unit followed in 4Q2025 at S$4,968,000, or S$2,367 psf. Then 2Q2026 brought a 06-10 storey sale at S$4,800,000, working out to S$2,287 psf. Same floor area, three different storey bands, three different psf figures.
The other two entries are 1,647 sqft. One sold in 2Q2026 for S$4,100,000, at S$2,490 psf. The other sold in 1Q2026 from the 01-05 range, at S$4,072,000, or S$2,473 psf. Both of those psf figures are above all three of the larger sales. That is a familiar shape in caveat data, where the bigger absolute prices do not always carry the bigger rate by area. Five sales is not enough to call it a pattern at this project. The table below lists them.
| Quarter | Storey range | Area | Price | Per sqft |
|---|---|---|---|---|
| Q3 2025 | 21-25 | 2,099 sqft | S$5,050,000 | S$2,406 psf |
| Q4 2025 | 11-15 | 2,099 sqft | S$4,968,000 | S$2,367 psf |
| Q2 2026 | 06-10 | 2,099 sqft | S$4,800,000 | S$2,287 psf |
| Q2 2026 | 06-10 | 1,647 sqft | S$4,100,000 | S$2,490 psf |
| Q1 2026 | 01-05 | 1,647 sqft | S$4,072,000 | S$2,473 psf |
Our own estimate has been checked against 57 later sales at this project
We also run our estimate back against what actually transacted. As of 4Q2025, the test at Jadescape covered 57 later sales. The median error came to 3.4%. Thirty per cent of those sales landed inside the stated range. The two figures measure different things. Median error is how far the middle estimate sat from the recorded price. The hit rate is how often the recorded price fell within the band we published around it. A 30% hit rate says the band was narrow relative to the spread of prices here, which the percentile columns in the first table already hinted at. All of this is measured from recorded transactions, and none of it is a formal valuation.
In pictures
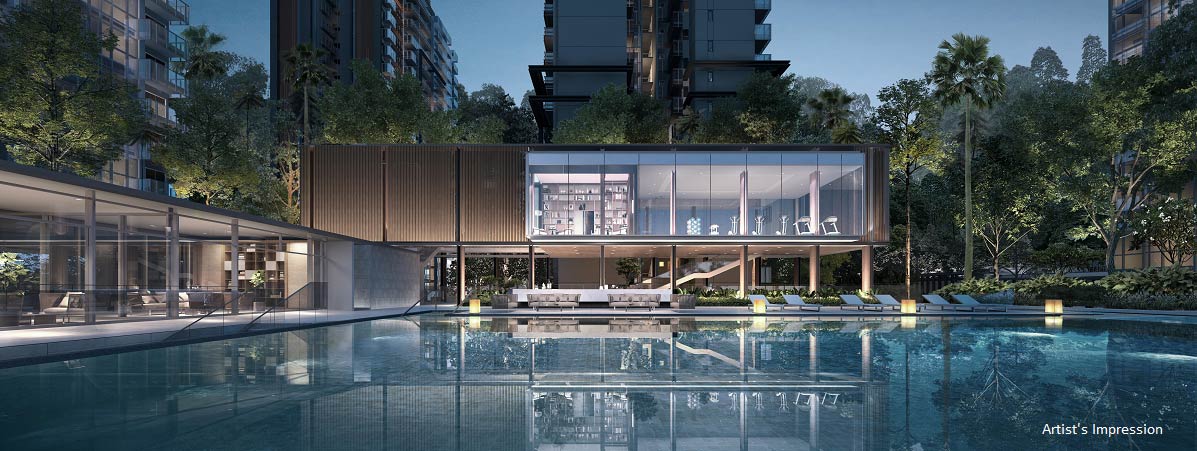
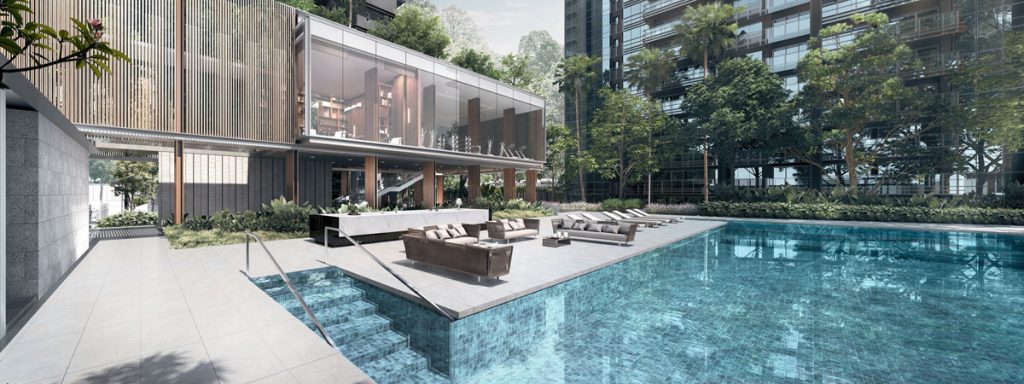
A few things the figures leave open. The 2Q2026 median rests on 13 sales, the thinnest count in the eight quarters shown. Its percentile spread is also the widest in the table. We cannot tell from this data whether that reflects price movement or simply a different mix of units. The size bands help, but two of them have fewer than eight resales. The rental side is steadier, with 38 to 56 contracts a quarter. What next quarter's data settles is whether volume returns to the high twenties, as it did in 3Q2024, 1Q2025 and 3Q2025, and what the median does when it has more sales behind it.
A single quarterly median rarely carries much on its own. It is one number pulled from whatever happened to change hands in three months. It becomes useful when you sit it next to the counts, the spread, the size mix, the rents, and the projects down the road. Read that way, Jadescape over these eight quarters looks less like a clean upward line and more like a project trading across a wide band of unit types. The direction is there in the table. The certainty is not.
Method: URA resale caveats at the project (developer sales and sub-sales excluded) by the quarter of the sale month. Size bands by caveated floor area. Rents are URA rental contracts at the project, and the gross yield is the mean of the quarterly median rents per square foot, annualised, over the four-quarter resale median per square foot, before any cost. Lease left is the tenure less the years since the lease started, as recorded. The estimate accuracy is this site's backtest: the engine run as of the quarter named, compared with the sales since. Private figures are from URA Data Service caveats, HDB figures from data.gov.sg resale records, both loaded weekly by this site's ingest. Medians are of the non-excluded transactions in the period named. Sales flagged by the hygiene rules (related-party transfers, bulk deals, outliers) are left out. Every figure is indicative and drawn from recorded transactions, not a formal valuation.