Dunearn House Has Sold 216 Of Its 380 Units At A Median Of S$3,107 psf — But Only 17 Of Them Landed In August
Published 22 Sept 2026 · Dunearn House
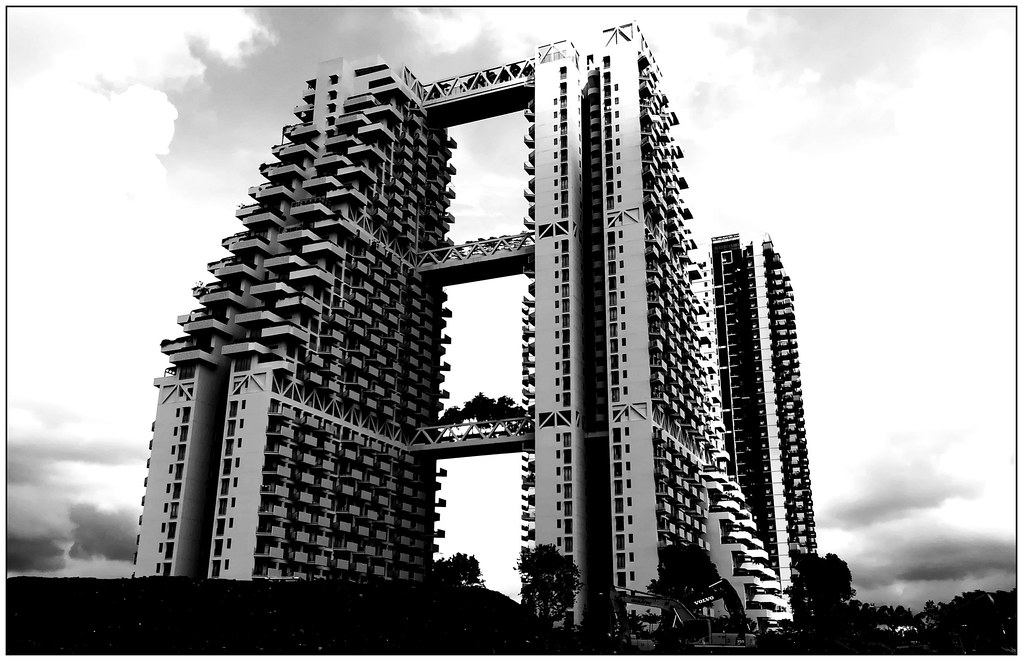
A launch that sells more than half of its units early on is a number people like to repeat. But this number hides something. It hides the shape of sales, month by month. At Dunearn House, that shape is lopsided. One month was very heavy. The next month was much thinner.
URA (Urban Redevelopment Authority) keeps records called caveats. Dunearn House is in District 11. It is a 99-year leasehold project. Since July 2026, 216 units were sold by the developer. All 216 sales happened within the three months up to August 2026. The overall median price was S$3,107 psf. These 216 sales make up 56.8% of the project's 380 units. July 2026 was the busiest month, with 199 caveats. August 2026 had only 17 caveats. The median price per square foot fell by 2.8% from the first month. It started at S$3,109 psf and dropped to S$3,023 psf in August 2026. Here is what stood out to us as we went through the tables.
Almost the entire sales record sits in a single month
The first thing to look at is the monthly split. Out of all caveats recorded up to August 2026, 199 are dated July 2026. Another 17 are dated August 2026. Together, this brings the total to 216 caveats, out of a project of 380 units. The table below cannot tell us one thing. It cannot tell us how much of the August number is due to real demand and how much is just timing. A caveat gets recorded when it is filed, not when a buyer first books the unit. Because of this, the launch month often collects a lot of activity all at once. The months after can look much quieter by comparison.
The median price per square foot also moved, and this gets less attention. In the first month, the median was S$3,109 psf. In August 2026, it was S$3,023 psf. This is a drop of 2.8% since launch. But only 17 caveats sit behind the August figure. That means the median rests on a small number of sales. A change in which unit sizes sold in a given month can shift the median easily. In other words, this change simply shows what the recorded sales looked like. It does not measure whether prices dropped on similar units. Both the table and the bar chart below cover the same two months.
Taken together, the month-by-month record shows a launch where most sales happened early on. The second month added only a small number of caveats, at a slightly lower median.
| Month | Caveats | Cumulative | Median psf |
|---|---|---|---|
| July 2026 | 199 | 199 | S$3,109 psf |
| August 2026 | 17 | 216 | S$3,023 psf |
Median psf steps up with every jump in unit size
The size bands follow a clean order. Units under 50 sqm recorded 19 caveats. Their median price was S$1,559,000, or S$2,956 psf, on a median area of 527 sqft. The 50 to 69 sqm band sold the most units, with 78 caveats. Its median price was S$2,012,000, or S$3,082 psf, on a median area of 657 sqft. The 70 to 89 sqm band had 49 caveats. Its median price was S$2,858,000, or S$3,090 psf. This is barely different from the band below it on a per-square-foot basis, even though the median price itself is much higher.
Above that, the 90 to 119 sqm band recorded 60 caveats. Its median price was S$3,632,000, or S$3,201 psf, on a median area of 1,184 sqft. The 120 sqm and above band is the highest on both measures. Its median price was S$4,366,500, or S$3,273 psf. This top band rests on only 10 caveats. It is the thinnest line in the table, and the one we would treat most carefully. Across the five bands, the pattern suggests that larger units sold at higher prices per square foot here. This is not the pattern every project shows. The full breakdown is set out in the table below.
| Size band | Caveats | Median area | Median price | Median psf |
|---|---|---|---|---|
| under 50 sqm | 19 | 527 sqft | S$1,559,000 | S$2,956 psf |
| 50 to 69 sqm | 78 | 657 sqft | S$2,012,000 | S$3,082 psf |
| 70 to 89 sqm | 49 | 936 sqft | S$2,858,000 | S$3,090 psf |
| 90 to 119 sqm | 60 | 1,184 sqft | S$3,632,000 | S$3,201 psf |
| 120 sqm and above | 10 | 1,345 sqft | S$4,366,500 | S$3,273 psf |
The launch median sits 33.5% above resales within a kilometre
To compare the launch figures with existing homes nearby, we looked at resale caveats within 1,000 metres over the 24 months up to August 2026. In that time and area, there were 250 resales across 41 completed projects. Their median price was S$2,326 psf. The Dunearn House median of S$3,107 psf is 33.5% higher than this. But this comparison mixes different lease types, building ages, and unit sizes on the resale side. So it shows a gap between two different groups of sales, not a fair comparison of the same type of home.
Among the eight projects listed below, Fourth Avenue Residences had the most sales. It recorded 39 resales, at 624 metres away, with a median of S$2,540 psf. Royalgreen is the closest project, at 340 metres away. It had 13 resales at S$2,835 psf, the highest median in the group. At the other end, The Teneriffe, also on a 99-year lease, recorded 15 resales at S$1,144 psf, from 850 metres away. The table only shows part of the 41 projects within the radius. It does not show floor area or years left on the lease. Both of these factors affect resale medians like these.
| Project | Tenure | TOP | Distance | Resales | Median psf |
|---|---|---|---|---|---|
| Fourth Avenue Residences | 99 | — | 624 m | 39 | S$2,540 psf |
| The Cascadia | freehold | — | 662 m | 31 | S$2,279 psf |
| The Tessarina | freehold | — | 508 m | 28 | S$2,312 psf |
| Watten Estate | freehold | — | 790 m | 18 | S$2,639 psf |
| The Nexus | freehold | — | 765 m | 17 | S$2,349 psf |
| The Teneriffe | 99 | — | 850 m | 15 | S$1,144 psf |
| Floridian | freehold | — | 916 m | 14 | S$2,423 psf |
| Royalgreen | freehold | — | 340 m | 13 | S$2,835 psf |
No other launch in District 11 came close on volume over the past year
Compared to other launches in the district, the sales volume at Dunearn House stands out. Over the 12 months up to August 2026, Sanctuary@newton recorded the most developer sales among other District 11 launches. It had 13 caveats at a median of S$2,739 psf. Watten House came next, with 11 caveats and a median of S$3,256 psf. Both of these projects are freehold, meaning the land is owned outright, with no lease limit. This is worth remembering when comparing their medians to a 99-year leasehold project.
The rest of the list has very small numbers. 32 Gilstead recorded 2 caveats at a median of S$3,513 psf. Enchanté recorded 2 caveats at S$2,700 psf. Three landed home transactions each had just one caveat: Hillcrest Road at S$4,505 psf, Chancery Lane, on a 999-year lease, at S$3,660 psf, and Mount Rosie Road at S$2,594 psf. A median based on just one caveat is simply that single sale. So these rows describe individual sales, not a general price level for the street. The district comparison is laid out in the table below.
| Project | Tenure | Expected TOP | Caveats | Median psf |
|---|---|---|---|---|
| Sanctuary@newton | freehold | — | 13 | S$2,739 psf |
| Watten House | freehold | — | 11 | S$3,256 psf |
| Enchanté | freehold | — | 2 | S$2,700 psf |
| 32 Gilstead | freehold | — | 2 | S$3,513 psf |
| Landed, Hillcrest Road | freehold | — | 1 | S$4,505 psf |
| Landed, Chancery Lane | 999 | — | 1 | S$3,660 psf |
| Landed, Mount Rosie Road | freehold | — | 1 | S$2,594 psf |
Two months is a short record, so several questions remain open. The caveats cover 56.8% of the units. This leaves the rest of the project completely outside this data. The August median is based on a small enough number of sales that the mix of unit sizes sold in any one month can shift it. The next release will show whether the monthly caveat count stays close to the 17 recorded in August 2026, or rises again. It will also show whether the size bands that drove the launch, especially the 78 caveats in the 50 to 69 sqm band, keep the same share of activity. All these figures are indicative. They come from recorded transactions. None of them is a valuation of any home.
We keep coming back to the same habit when reading a launch. One median, on its own, tends to flatten everything interesting about a project. Here, the price per square foot rises with unit size. The sales volume is concentrated in the first month. And the gap to nearby resales is measured against a group of properties that mixes different lease types and ages. The useful part is not any single number. It is how these numbers fit together, and how they compare with what the next month of caveats adds to the same tables.
Method: URA caveats for developer sales ('new sale') at the project, dated to the month; size bands by the caveated floor area; the nearby comparison is resale caveats in completed projects within one kilometre over 24 months, unadjusted for size, age or floor. Units sold is the caveat count, which lags option exercises by weeks. Private figures are from URA Data Service caveats, HDB figures from data.gov.sg resale records, both loaded weekly by this site's ingest. Medians are of the non-excluded transactions in the period named; sales flagged by the hygiene rules (related-party transfers, bulk deals, outliers) are left out. Every figure is indicative and drawn from recorded transactions, not a formal valuation.