Rivelle Tampines Has Cleared 75.5% Of Its 572 Units — But Only 23 Of Them In The Past Three Months
Published 22 Sept 2026 · Rivelle Tampines
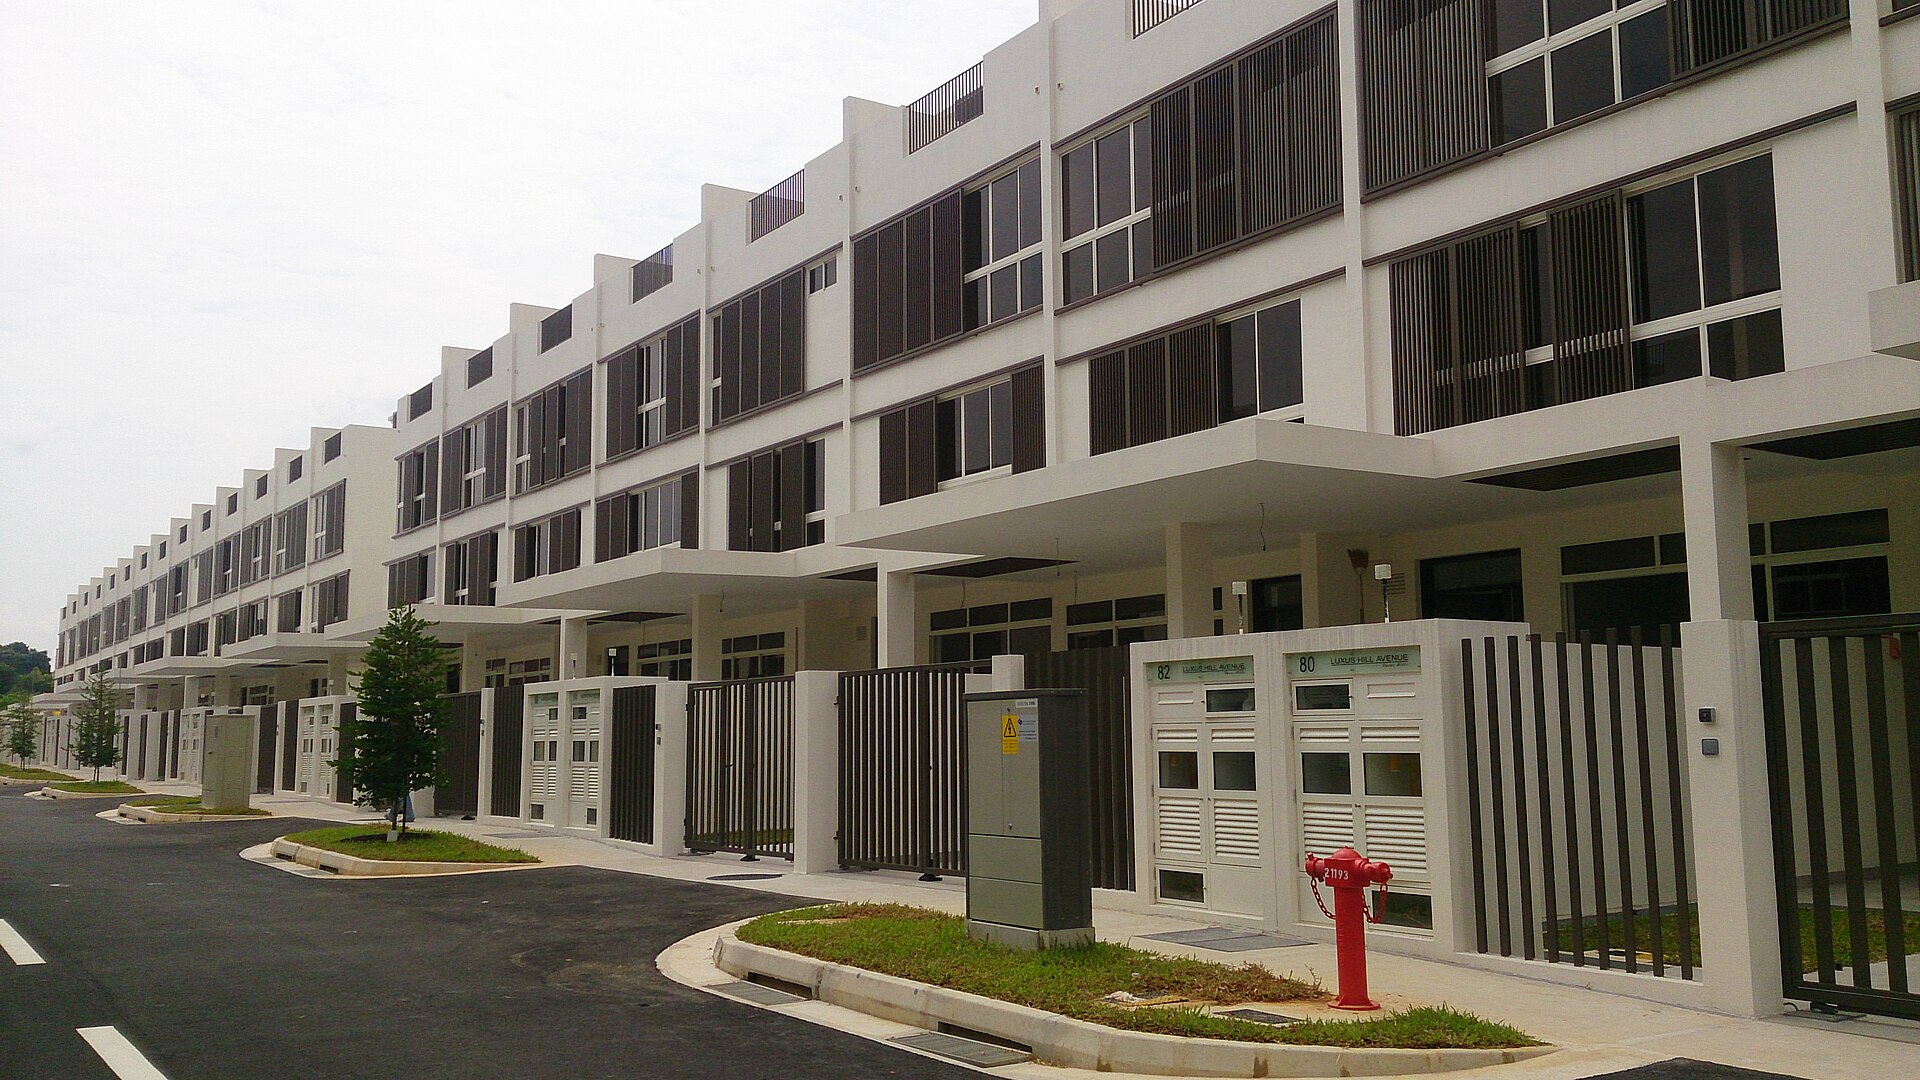
A project can seem both fast-selling and slow-selling, depending on which month you look at. Rivelle Tampines shows this clearly. Three-quarters of the development has been sold. But the last quarter of sales was so small it would fit in a small function room.
According to URA Data Service caveat records, the 572-unit project in District 18 is leasehold for 99 years. It has recorded 432 developer sales since March 2026. The overall median price is $1,933 psf. This is 75.5% of the project. Of those 432 caveats, 23 were recorded in the three months up to August 2026. Only 6 of these were in August itself. The busiest month was March 2026, the first month of sales, with 332 caveats. Over these six months, the median price per square foot rose by 0.4%, from $1,936 psf in the first month to $1,944 psf in August 2026.
Almost eight in ten of the project's caveats were lodged in its first month on the market
The month-by-month table gives the clearest picture. March 2026 had 332 caveats. April 2026 added another 64. Together, these add up to 396 by the time May begins. After that, the numbers become much smaller. May 2026 had 13 caveats. June had 9. July had 8. August had 6.
This pattern is common for a new project launch. It is worth being clear about what the table shows and does not show. Caveats are official records of completed deals, not a list of bookings. So the monthly counts show when deals were officially recorded, not when units first went on sale. The table also does not say which blocks or floors are still unsold. It only shows how many sales were recorded each month and their median price.
What the table does show is that the price picture for this project depends heavily on March 2026. The medians for later months come from just a few caveats each. Small numbers of sales can make the median jump around easily. The table below sets out the monthly detail.
| Month | Caveats | Cumulative | Median psf |
|---|---|---|---|
| March 2026 | 332 | 332 | S$1,936 psf |
| April 2026 | 64 | 396 | S$1,918 psf |
| May 2026 | 13 | 409 | S$1,939 psf |
| June 2026 | 9 | 418 | S$1,934 psf |
| July 2026 | 8 | 426 | S$1,921 psf |
| August 2026 | 6 | 432 | S$1,944 psf |
The median psf has moved less than half a percent across six months of selling
Looking only at the median column, the project's prices look very steady. The first month recorded $1,936 psf. April 2026 came in at $1,918 psf. May 2026 was $1,939 psf. August 2026 was $1,944 psf. The change from the first month to the latest month is 0.4%.
There is an important point to note here: the mix of units sold each month differs. A median based on 6 sales is not measuring the same thing as a median based on 332 sales. If later sales happened to be smaller units, higher floors, or a different mix of unit types, the median could shift for reasons unrelated to pricing policy. The data here cannot separate these effects. So the steady prices simply describe what was recorded, not what any single unit is truly worth.
The bar chart below shows how uneven the monthly sales numbers are. This is the background needed to understand the later median prices.
The mid-sized units did the heavy lifting, and psf barely separates the three size bands
Splitting the 432 caveats by unit size, the 90 to 119 sqm size band was the most sold, with 239 caveats. This band had a median area of 1,109 sqft, a median price of $2,143,000, and a median of $1,937 psf. The 70 to 89 sqm band had 159 caveats, with a median price of $1,735,000, or $1,924 psf. The 120 sqm and above band had 34 caveats, with a median price of $2,673,500, or $1,940 psf.
What stands out is how little the price per square foot changes across the three size bands. Usually the smallest units have the highest price per square foot. Here, the pattern runs slightly the other way. The largest size band actually has the highest median psf of the three. The difference is small enough that other factors, such as floor level within each band, could explain it. The data does not go into that much detail.
The actual prices, of course, are quite different between bands. The table below sets out each size band.
| Size band | Caveats | Median area | Median price | Median psf |
|---|---|---|---|---|
| 70 to 89 sqm | 159 | 926 sqft | S$1,735,000 | S$1,924 psf |
| 90 to 119 sqm | 239 | 1,109 sqft | S$2,143,000 | S$1,937 psf |
| 120 sqm and above | 34 | 1,378 sqft | S$2,673,500 | S$1,940 psf |
Resale homes within a kilometre transacted 44.0% below the launch median
To compare the launch price with the local area, we looked at resale transactions within 1,000 metres of the site over the 24 months up to August 2026. There were 109 such resales across 7 completed projects, at a median of $1,342 psf. Compared to that, the launch median of $1,933 psf is 44.0% higher.
Looking at each project separately shows why a single neighbourhood median should be treated carefully. Aquarius By The Park, 585 metres away, had 48 resales at $1,343 psf. The Clearwater, 677 metres away, had 15 resales at $1,342 psf. Both are leasehold projects. Tanamera Crest had 19 resales at $1,161 psf. Baywater had 16 resales at $1,393 psf. The freehold projects show different results, based on small numbers of sales. Peakville Park had 6 resales at $2,372 psf. Picardy Gardens had 4 resales at $1,594 psf. A single landed home sale on Jalan Pari Dedap was recorded at $1,207 psf.
These are completed projects of different ages and ownership types, being compared with a new leasehold launch. So the price difference reflects a mix of age, ownership type, and newness together. The table below lists each project.
| Project | Tenure | TOP | Distance | Resales | Median psf |
|---|---|---|---|---|---|
| Aquarius By The Park | 99 | — | 585 m | 48 | S$1,343 psf |
| Tanamera Crest | 99 | — | 905 m | 19 | S$1,161 psf |
| Baywater | 99 | — | 890 m | 16 | S$1,393 psf |
| The Clearwater | 99 | — | 677 m | 15 | S$1,342 psf |
| Peakville Park | freehold | — | 953 m | 6 | S$2,372 psf |
| Picardy Gardens | freehold | — | 802 m | 4 | S$1,594 psf |
| Landed, Jalan Pari Dedap | freehold | — | 975 m | 1 | S$1,207 psf |
Rivelle Tampines outsold the rest of District 18's launch activity several times over
Looking at other new launches in District 18 with developer sales in the 12 months up to August 2026, Parktown Residence recorded the most, with 63 caveats at a median of $2,331 psf. Aurelle Of Tampines had 8 caveats at $1,812 psf. Tenet had 3 caveats at $1,781 psf. All three projects are leasehold for 99 years.
Compared with Rivelle Tampines' 432 caveats over six months, this district comparison is not really a fair contest. It is more a reminder that projects are at different stages of selling. A project further along in its selling process will naturally record fewer caveats in any given period, no matter its price. The numbers here are small enough that their medians carry limited weight.
Looking only at price per square foot, Rivelle Tampines' $1,933 psf sits between Parktown Residence, the highest in this group, and the two lower-priced projects. The table below shows the district launches side by side.
| Project | Tenure | Expected TOP | Caveats | Median psf |
|---|---|---|---|---|
| Parktown Residence | 99 | — | 63 | S$2,331 psf |
| Aurelle Of Tampines | 99 | — | 8 | S$1,812 psf |
| Tenet | 99 | — | 3 | S$1,781 psf |
What this data does not tell us is the price at which the remaining quarter of the project will sell. With only 23 caveats in the three months up to August 2026, each extra month adds just a handful of new records. Medians based on single-digit counts of sales will shift due to unit mix, not due to any real pricing trend. The next few months of URA Data Service caveats will show whether the pace stays in the high single digits. They will also show whether the psf range the project has stayed in since March 2026 continues, as the number of unsold units shrinks. The resale comparison within 1,000 metres is also worth checking again later, since those 109 transactions cover 24 months and include both leasehold and freehold properties of very different ages.
One headline number, whether it is 75.5% sold or a 44.0% gap to nearby resales, rarely carries a project on its own. The more useful reading comes from stacking them: a front-loaded first month, a flat median across six, and a neighbourhood of older completed homes transacting at a different level entirely. Each figure here is indicative and drawn from recorded transactions, not a valuation of any particular home, and the picture only makes sense when they sit together.
Method: URA caveats for developer sales ('new sale') at the project, dated to the month; size bands by the caveated floor area; the nearby comparison is resale caveats in completed projects within one kilometre over 24 months, unadjusted for size, age or floor. Units sold is the caveat count, which lags option exercises by weeks. Private figures are from URA Data Service caveats, HDB figures from data.gov.sg resale records, both loaded weekly by this site's ingest. Medians are of the non-excluded transactions in the period named; sales flagged by the hygiene rules (related-party transfers, bulk deals, outliers) are left out. Every figure is indicative and drawn from recorded transactions, not a formal valuation.