What $2.6M Bought In District 4 In 2Q2026 — 26 Resales, And The Largest Was 1,464 sqft At Reflections At Keppel Bay
Published 22 Sept 2026
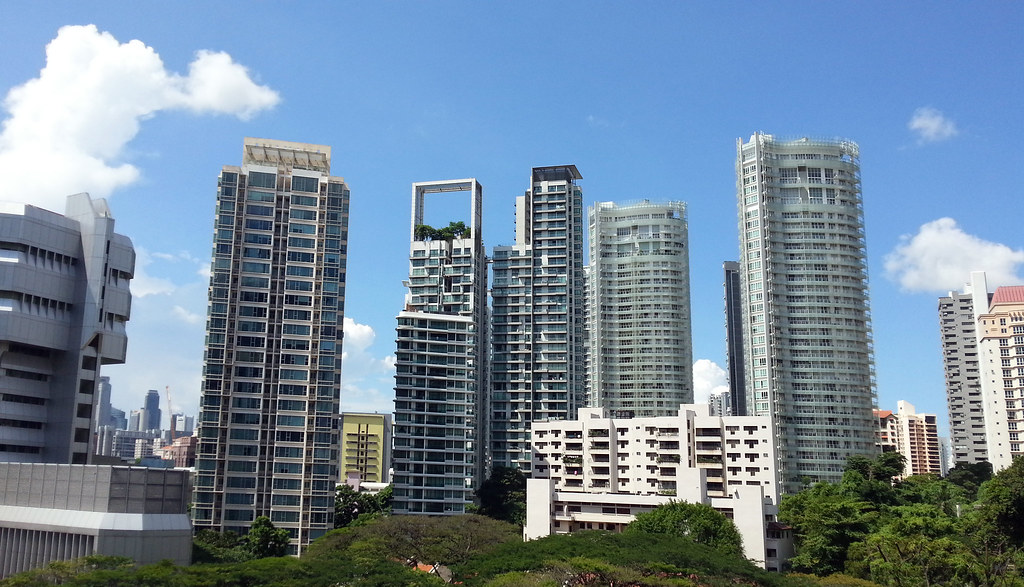
District 4 looks like an area that needs a very large budget. It includes Sentosa Cove, Keppel Bay, and the waterfront part of Telok Blangah. But a budget only matters when compared to what actually sold. Many deals in the quarter sold for less than the district's typical price. We wanted to see what a $2,600,000 budget could buy, based on actual sales. We did not look at asking prices or listed prices. We only looked at deals that closed.
This information comes from URA Data Service caveats. In District 4, there were 64 private home resales in the second quarter of 2026 (2Q2026), which covers April to June 2026. Of these, 26 sales, or 40.6%, were priced at $2,600,000 or less. These 26 sales were spread across 11 different projects. The middle price per square foot (psf) for these 26 sales was $1,725. This $1,725 psf median is compared to the whole district's median of $1,780 psf. The difference is -3.1%. The district's median resale price for the quarter was $2,790,000. A $2,600,000 budget falls at the 40th percentile of the quarter's prices, rounded down to the nearest $100,000. This means 40% of sales were at or below this price. All the numbers here are based on recorded caveats, not on any official valuation.
Four in ten of the quarter's District 4 resales closed at or under $2.6M
The first point to notice is the share of sales. Twenty-six of the 64 resales in the quarter were priced at or under the budget. This equals 40.6% of all resales recorded in District 4 between April and June 2026. This is not a small or unusual slice of the market. These sales were spread across 11 different projects, not concentrated in one project.
The comparison of price per square foot is more interesting. The median psf for sales under the budget was $1,725. This compares to $1,780 psf for the whole district. The difference is -3.1%. This means buying under the $2,600,000 ceiling did not mean buying at a much lower price per square foot last quarter. The lower budget mostly bought a smaller total price, not a much cheaper rate per square foot.
Here is a word of caution before looking at the tables. Sixty-four resales is a small number for one quarter. Twenty-six is even smaller. This means the mix of projects and unit sizes that happened to sell can shift the median on its own. We see these numbers as a description of what sold in 2Q2026, not as a sign of a trend.
The largest unit under the budget was 1,464 sqft at Reflections At Keppel Bay
Looking at the under-budget sales ranked by size, the largest is a 1,464 sqft unit at Reflections At Keppel Bay. It is on the 11th to 15th floor. It sold for $2,460,000, or $1,680 psf, in June 2026. This unit has a 99-year leasehold, meaning the buyer owns it for 99 years. Almost every other unit on this size list is also 99-year leasehold.
Below the top unit, the sizes are very close together. The next nine units range from 1,389 sqft down to 1,259 sqft. This shows that at this budget, the district's larger units come in a narrow size range, not a wide spread. Two units at The Pearl @ Mount Faber, sized 1,389 sqft and 1,356 sqft, both sold at $1,556 psf. Their prices were $2,160,000 and $2,110,000.
One sale matched the $2,600,000 ceiling exactly. This was a 1,270 sqft unit at Caribbean At Keppel Bay, on the first to fifth floor. It sold for $2,600,000, or $2,047 psf, in June 2026. The full list of ten largest sales is shown in the table below.
| Project | Type | Tenure | TOP | Area | Storey range | Price | Per sqft | Month |
|---|---|---|---|---|---|---|---|---|
| Reflections At Keppel Bay | condo | 99-year leasehold | — | 1,464 sqft | 11-15 | S$2,460,000 | S$1,680 psf | Jun 2026 |
| The Pearl @ Mount Faber | condo | 99-year leasehold | — | 1,389 sqft | 06-10 | S$2,160,000 | S$1,556 psf | Jun 2026 |
| Reflections At Keppel Bay | condo | 99-year leasehold | — | 1,378 sqft | 01-05 | S$2,400,888 | S$1,743 psf | Apr 2026 |
| Caribbean At Keppel Bay | condo | 99-year leasehold | — | 1,378 sqft | 01-05 | S$2,430,000 | S$1,764 psf | May 2026 |
| The Pearl @ Mount Faber | condo | 99-year leasehold | — | 1,356 sqft | 06-10 | S$2,110,000 | S$1,556 psf | Apr 2026 |
| The Oceanfront @ Sentosa Cove | condo | 99-year leasehold | — | 1,356 sqft | 06-10 | S$2,220,000 | S$1,637 psf | Jun 2026 |
| Reflections At Keppel Bay | condo | 99-year leasehold | — | 1,324 sqft | 01-05 | S$2,100,000 | S$1,586 psf | Apr 2026 |
| Caribbean At Keppel Bay | condo | 99-year leasehold | — | 1,281 sqft | 06-10 | S$2,450,000 | S$1,913 psf | Jun 2026 |
| Caribbean At Keppel Bay | condo | 99-year leasehold | — | 1,270 sqft | 01-05 | S$2,600,000 | S$2,047 psf | Jun 2026 |
| The Interlace | condo | 99-year leasehold | — | 1,259 sqft | 06-10 | S$2,335,000 | S$1,854 psf | Apr 2026 |
Keppel Bay addresses fill most of the size list, but they did not transact at one price
Of the ten largest under-budget sales, six are in Keppel Bay. Three are at Reflections At Keppel Bay and three are at Caribbean At Keppel Bay. The other four are two units at The Pearl @ Mount Faber, one at The Oceanfront @ Sentosa Cove, and one at The Interlace.
One thing that stands out is how different the price per square foot can be within this group. A 1,324 sqft unit at Reflections At Keppel Bay, on the first to fifth floor, sold for $2,100,000, or $1,586 psf, in April. A 1,281 sqft unit at Caribbean At Keppel Bay, on the sixth to tenth floor, sold for $2,450,000, or $1,913 psf, in June. Both units are under the $2,600,000 ceiling. Both are 99-year leasehold. Both are close in size.
The caveat data only records the floor range, unit size, tenure, and price. It does not record which stack the unit is in, the view, or the unit's condition. So the price difference between those two units is visible in the data, but the data cannot explain why. This shows that there is variation within a single project that a district-wide median cannot capture.
The lowest psf under the budget was $1,549 at Harbour View Towers
Ranking the same 26 sales by price per square foot instead gives a different top of the list. The lowest price per square foot was a 1,206 sqft unit at Harbour View Towers, on the 16th to 20th floor. It is 99-year leasehold. It sold for $1,868,000, or $1,549 psf, in May 2026.
After that unit, the list stays close together. The two Pearl @ Mount Faber units at $1,556 psf come second and third. Next is a freehold unit, meaning the buyer owns it permanently with no time limit. Then several Reflections At Keppel Bay units follow, ranging from $1,585 psf to $1,692 psf. By the tenth entry, the price per square foot has only reached $1,692 psf. This shows that the cheaper end of this district's under-budget sales sit in a narrow price range, rather than spreading widely.
Five of the ten lowest price-per-square-foot sales are at Reflections At Keppel Bay. This includes a 1,066 sqft unit sold for $1,688,888, or $1,585 psf, and a 1,119 sqft unit sold for $1,818,000, or $1,624 psf. Both of these are on the sixth to tenth floor. The table below shows the complete ranking.
| Project | Type | Tenure | TOP | Area | Storey range | Price | Per sqft | Month |
|---|---|---|---|---|---|---|---|---|
| Harbour View Towers | condo | 99-year leasehold | — | 1,206 sqft | 16-20 | S$1,868,000 | S$1,549 psf | May 2026 |
| The Pearl @ Mount Faber | condo | 99-year leasehold | — | 1,389 sqft | 06-10 | S$2,160,000 | S$1,556 psf | Jun 2026 |
| The Pearl @ Mount Faber | condo | 99-year leasehold | — | 1,356 sqft | 06-10 | S$2,110,000 | S$1,556 psf | Apr 2026 |
| Harbour Suites | apartment | freehold | — | 753 sqft | 01-05 | S$1,185,000 | S$1,573 psf | Apr 2026 |
| Reflections At Keppel Bay | condo | 99-year leasehold | — | 1,066 sqft | 06-10 | S$1,688,888 | S$1,585 psf | Jun 2026 |
| Reflections At Keppel Bay | condo | 99-year leasehold | — | 1,324 sqft | 01-05 | S$2,100,000 | S$1,586 psf | Apr 2026 |
| Reflections At Keppel Bay | condo | 99-year leasehold | — | 1,119 sqft | 06-10 | S$1,818,000 | S$1,624 psf | Apr 2026 |
| The Oceanfront @ Sentosa Cove | condo | 99-year leasehold | — | 1,356 sqft | 06-10 | S$2,220,000 | S$1,637 psf | Jun 2026 |
| Reflections At Keppel Bay | condo | 99-year leasehold | — | 1,464 sqft | 11-15 | S$2,460,000 | S$1,680 psf | Jun 2026 |
| Reflections At Keppel Bay | condo | 99-year leasehold | — | 1,087 sqft | 01-05 | S$1,840,000 | S$1,692 psf | Jun 2026 |
Only one freehold unit appears on either list, and it is the smallest entry of the twenty
Across both tables, nineteen of the twenty listed sales are 99-year leasehold. The one exception is Harbour Suites, which is an apartment rather than a condo, and is freehold. This unit is 753 sqft, on the first to fifth floor. It sold for $1,185,000, or $1,573 psf, in April 2026. It is the only freehold sale in the top ten lowest price-per-square-foot list. It is also the smallest unit in either ranking, by a clear margin.
This one row matters because it stands alone. Out of 26 under-budget sales, only one is freehold in the visible ranking. This is not enough data to draw any conclusion about how leasehold or freehold status affected prices in District 4 this quarter. What the data does show is that at $2,600,000 and below, most recorded sales in 2Q2026 were leasehold waterfront properties. The one freehold sale had a much lower total price and a much smaller floor area than the others nearby.
These figures do not tell us about future direction. One quarter of data, with 64 resales and 26 of them under the ceiling, only shows what sold between April and June 2026, and at what prices. It does not tell us whether the -3.1% gap between the under-budget median and the district median will continue, or whether it simply reflects which units happened to sell this quarter. In the 3Q2026 caveats, we would want to check whether the share of sales under $2,600,000 stays near 40.6%. We would also check whether the project mix stays as concentrated in Keppel Bay. And we would check whether the cheaper sales keep clustering between $1,549 psf and $1,692 psf.
This is a reminder that one number rarely tells the full story of a district. A median price of $2,790,000 tells one story about District 4. But the fact that four out of ten resales sold at or under $2,600,000, at a price per square foot barely below the district's median, tells a different story about the same quarter. Neither number is wrong. They simply measure different parts of the same set of caveats. The most useful approach is to look at both numbers together, and compare them with what future quarters show.
Method: resale caveats (developer sales and sub-sales excluded) in the district and quarter named with a price at or under the budget, single-unit caveats only; ranked by caveated floor area and by price per square foot. These are recorded sales, not listings, and say nothing about what is available or what a unit would fetch now. Private figures are from URA Data Service caveats, HDB figures from data.gov.sg resale records, both loaded weekly by this site's ingest. Medians are of the non-excluded transactions in the period named; sales flagged by the hygiene rules (related-party transfers, bulk deals, outliers) are left out. Every figure is indicative and drawn from recorded transactions, not a formal valuation.