Parc Esta Has Traded 109 Times In Four Quarters At A Median Of S$2,299 psf — But Across Eight Quarters It Has Moved 0.4%
Published 22 Sept 2026 · Parc Esta
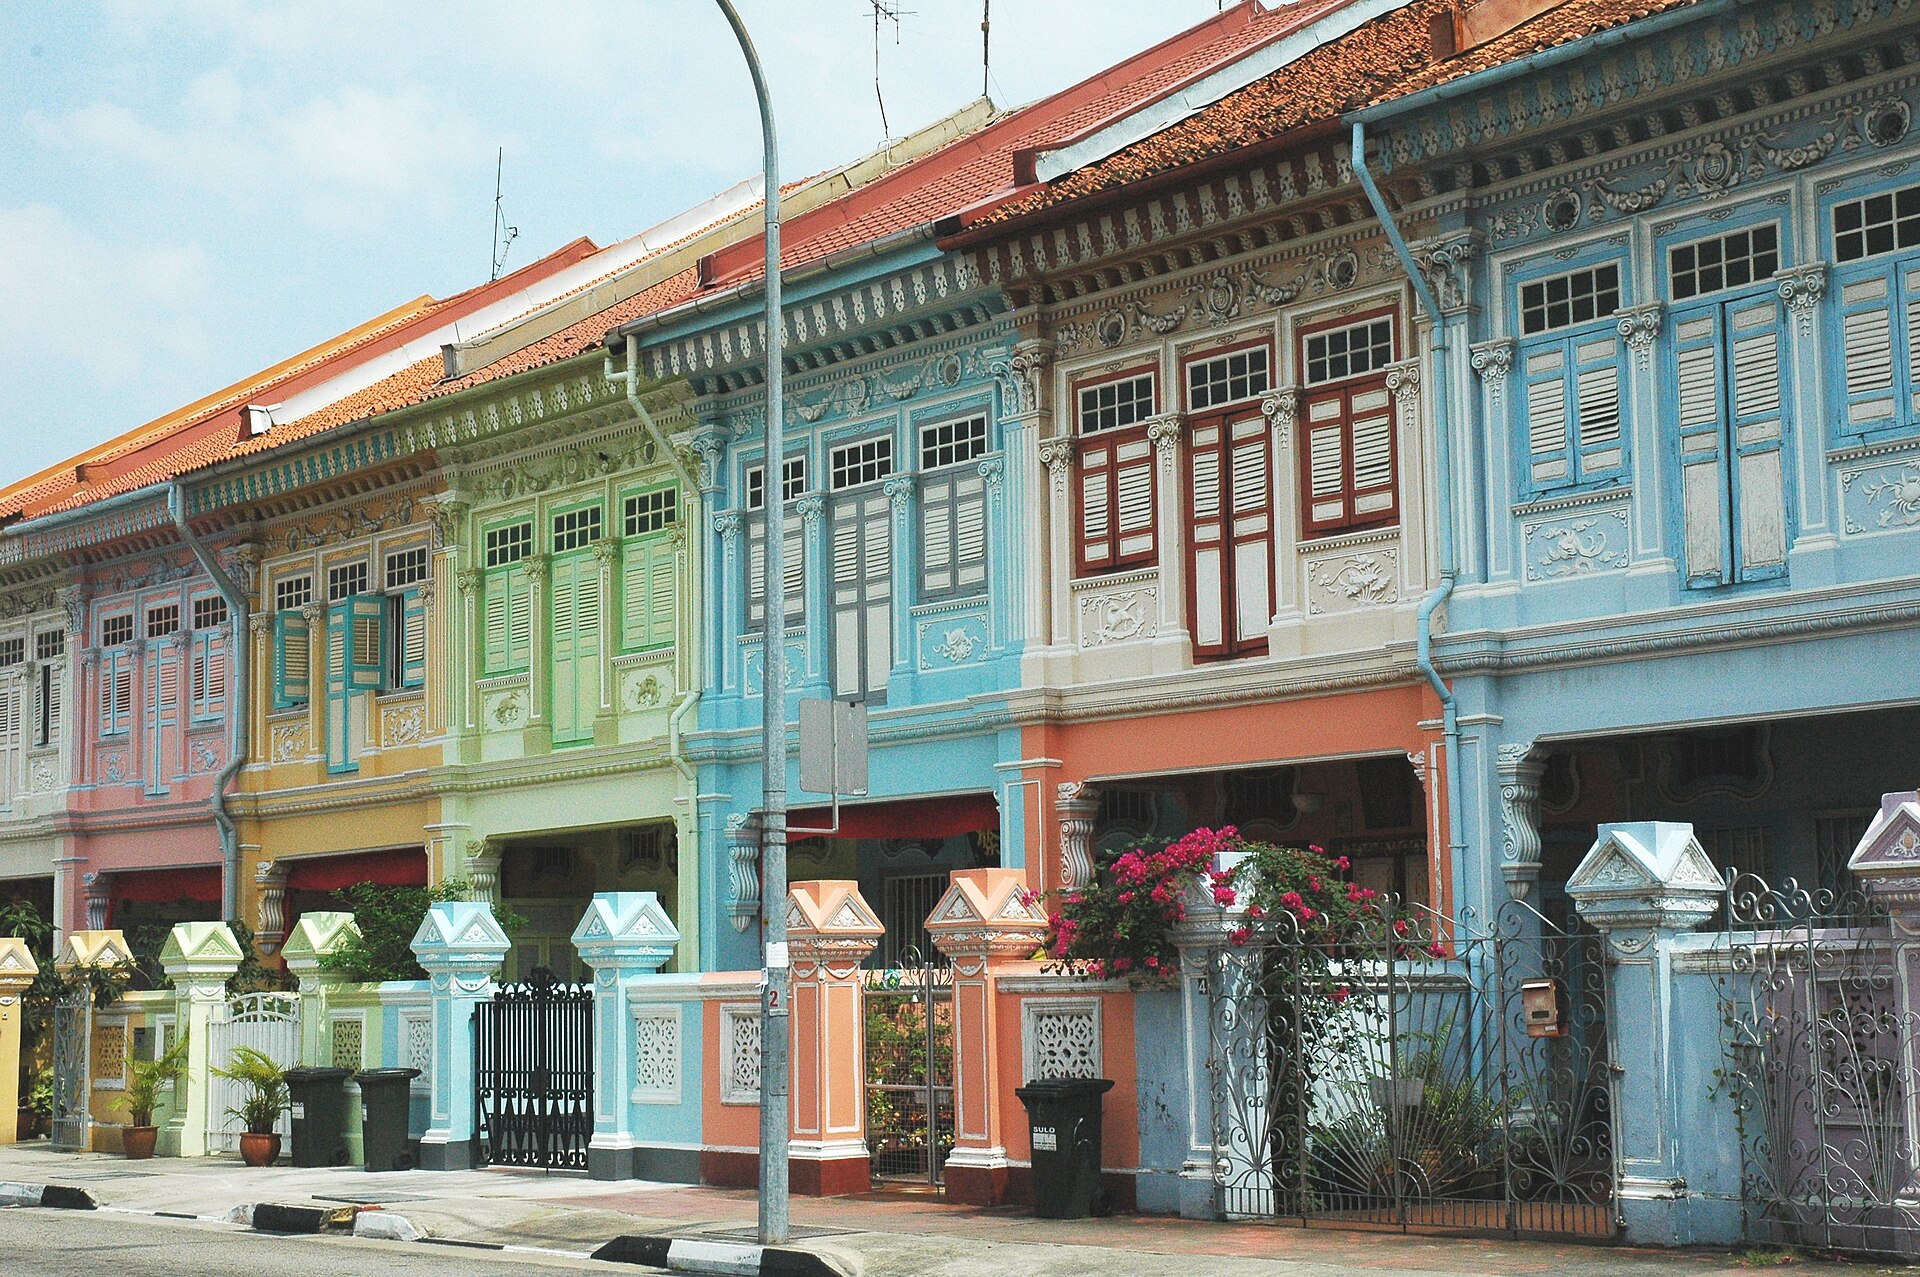
A project can have lots of sales but still show no real change in price. This is what happened at Parc Esta over the last two years. Parc Esta had a steady stream of resales every quarter. The median price climbed for a while. The latest reading has landed almost exactly where it started two years ago. The interesting part is not this flat line. It is what lies underneath it. This includes the size bands, the rental data, and the gap between the 25th and 75th percentiles. That gap has widened a lot over time.
This data comes from URA, Singapore's Urban Redevelopment Authority. URA collects caveat data for private homes. Parc Esta is a 99-year leasehold apartment project in District 14. It has 91 years left on its lease. From Q3 2025 to Q2 2026, Parc Esta recorded 109 resales. The median price was S$2,299 psf. Over eight quarters, from Q3 2024 to Q2 2026, the quarterly resale median moved up by 0.4%. It went from S$2,245 psf in Q3 2024, based on 26 sales, to S$2,255 psf in Q2 2026, also based on 26 sales. Over the same four-quarter window, the median resale price for the whole district was S$1,785 psf, based on 736 sales. This means Parc Esta's median was 28.8% higher than the district's.
Eight quarters of quarterly medians have ended up almost exactly where they started
The quarter-by-quarter path is not simply flat. It looks more like a small arc. The median rose from S$2,237 psf in Q4 2024 to S$2,292 psf in Q2 2025. It held near that level through Q3 2025, at S$2,288 psf. It peaked at S$2,343 psf in Q4 2025. Q1 2026 came in at S$2,330 psf. The latest quarter is back to the level of two years ago. Quarter-on-quarter, meaning compared with the quarter right before it, this is a step down. Year-on-year, meaning compared with the same quarter last year, the comparison against Q2 2025 is also lower.
The medians alone do not show how much wider the spread of prices has become. In Q3 2024, the 25th and 75th percentiles were S$2,200 psf and S$2,304 psf. These percentiles mark where the lower quarter and upper quarter of prices fall. By Q1 2026, the same two markers were S$2,192 psf and S$2,571 psf. In Q2 2026, they were S$2,149 psf and S$2,374 psf. This shows that a median can stay the same while the range of prices around it doubles. That is what has happened here. The number of sales also swings a lot. There were 40 sales in Q1 2025 and 23 in Q4 2025. So part of any single quarter's reading depends on which units happened to sell.
The table and chart below show both the medians and the number of sales behind them.
| Quarter | Resales | Median psf | 25th percentile | 75th percentile |
|---|---|---|---|---|
| Q3 2024 | 26 | S$2,245 psf | S$2,200 psf | S$2,304 psf |
| Q4 2024 | 34 | S$2,237 psf | S$2,177 psf | S$2,305 psf |
| Q1 2025 | 40 | S$2,275 psf | S$2,233 psf | S$2,336 psf |
| Q2 2025 | 32 | S$2,292 psf | S$2,244 psf | S$2,339 psf |
| Q3 2025 | 30 | S$2,288 psf | S$2,228 psf | S$2,355 psf |
| Q4 2025 | 23 | S$2,343 psf | S$2,237 psf | S$2,447 psf |
| Q1 2026 | 30 | S$2,330 psf | S$2,192 psf | S$2,571 psf |
| Q2 2026 | 26 | S$2,255 psf | S$2,149 psf | S$2,374 psf |
Psf rises steadily with unit size, which is the opposite of the usual pattern
Breaking the 109 resales down by size gives a clearer picture than looking at quarters alone. Units of 50 to 69 square metres were the most traded size band. There were 36 resales in this band, at a median price of S$1,650,000, or S$2,312 psf, on a median size of 727 square feet. Below that, the 27 resales under 50 square metres had a median price of S$978,000, or S$2,144 psf. Above it, 24 resales in the 70 to 89 square metre band had a median of S$2,065,000, or S$2,391 psf. In the 90 to 119 square metre band, 19 resales had a median of S$2,660,000, or S$2,485 psf.
The pattern is consistent: each larger size band has a higher median psf than the one below it. In many projects, the smallest units have the highest psf, so this pattern is worth noting. However, the top band is based on only three sales, so it should be read with caution. This also means the project-wide median of S$2,299 psf partly reflects the mix of units sold. A quarter with more of the smallest units will show a lower median, even if no single unit's price actually changed.
The full breakdown by size band is below.
| Size band | Resales | Median area | Median price | Median psf |
|---|---|---|---|---|
| under 50 sqm | 27 | 452 sqft | S$978,000 | S$2,144 psf |
| 50 to 69 sqm | 36 | 727 sqft | S$1,650,000 | S$2,312 psf |
| 70 to 89 sqm | 24 | 883 sqft | S$2,065,000 | S$2,391 psf |
| 90 to 119 sqm | 19 | 1,055 sqft | S$2,660,000 | S$2,485 psf |
| 120 sqm and above | 3 | 1,399 sqft | S$3,600,000 | S$2,573 psf |
Rental contracts fell by a third from their Q4 2025 peak while the psf rent barely moved
The rental data, also from URA, tells a quieter story than the resale figures. There were 64 rental contracts at Parc Esta in Q2 2026, at a median of S$6.92 psf per month. The median monthly rent was S$4,375. Three quarters earlier, in Q3 2025, there were 87 contracts at a median of S$6.9 psf per month, with a median monthly rent of S$3,800. The highest number of contracts came in Q4 2025, with 100 contracts. In that quarter, the psf median dipped to S$6.6, while the median monthly rent was S$4,300.
These two figures can move in different directions because they measure different things. The psf figure adjusts for the size of the unit. The monthly figure does not. A quarter with more large units rented out will raise the monthly median, even if the psf median stays the same or falls. Comparing the rental median to the resale median, our engine calculates the Q2 2026 rental figure as an indicative gross yield of about 3.5%. This yield is a measured figure based on recorded contracts and sales. It is not a valuation of any single unit.
The quarterly rental record is below.
| Quarter | Contracts | Median rent (S$ psf a month) | Median monthly rent |
|---|---|---|---|
| Q3 2025 | 87 | 6.9 | S$3,800 |
| Q4 2025 | 100 | 6.6 | S$4,300 |
| Q1 2026 | 90 | 6.8 | S$4,150 |
| Q2 2026 | 64 | 6.9 | S$4,375 |
Nothing within a kilometre trades at Parc Esta's level except the landed transactions
Parc Esta's median is 28.8% higher than the District 14 median of S$1,785 psf. That is one comparison. Looking at nearby projects is another. Within one kilometre, over the same four quarters, all the freehold non-landed projects with recorded resales had lower medians than Parc Esta. Freehold means the land is owned outright, with no lease expiry. Kembangan Estate, 709 metres away, had the highest median among them, at S$2,110 psf, based on 6 resales. Katong Regency followed at S$1,995 psf, based on 5 resales. Parc Elegance came next at S$1,699 psf, based on 7 resales. Millage, Celestia and Parc Bleu ranged between S$1,390 psf and S$1,631 psf.
Only two entries were priced above Parc Esta, and both are landed homes. Joo Chiat Place was at S$2,894 psf, based on 4 transactions. Langsat Road was at S$2,683 psf, based on 5 transactions. Landed homes are a different type of property, built on their own land, so this comparison is descriptive rather than a direct like-for-like match. More broadly, every neighbouring project listed here had fewer than eight recorded resales in this period, compared with 109 at Parc Esta. This means their medians rest on very few sales and can shift with just one transaction. The lease terms also differ. The neighbouring projects listed are freehold, while Parc Esta is 99-year leasehold, with 91 years remaining.
The nearby projects, with distances and counts, are below.
| Project | Tenure | TOP | Distance | Resales | Median psf |
|---|---|---|---|---|---|
| Parc Elegance | freehold | — | 700 m | 7 | S$1,699 psf |
| Kembangan Estate | freehold | — | 709 m | 6 | S$2,110 psf |
| Millage | freehold | — | 431 m | 5 | S$1,581 psf |
| Parc Bleu | freehold | — | 744 m | 5 | S$1,390 psf |
| Landed, Langsat Road | freehold | — | 402 m | 5 | S$2,683 psf |
| Katong Regency | freehold | — | 999 m | 5 | S$1,995 psf |
| Landed, Joo Chiat Place | freehold | — | 533 m | 4 | S$2,894 psf |
| Celestia | freehold | — | 448 m | 4 | S$1,631 psf |
The same price, S$3,600,000, was paid twice in Q1 2026 for identically sized units
The highest prices recorded in this window were a pair of sales in Q1 2026. Both sold for S$3,600,000, for a unit size of 1,399 square feet, working out to S$2,573 psf each. One was on the 16th to 20th floor, the other on the 11th to 15th floor. These were the highest resale prices in the four quarters covered here. This was also the quarter when the 75th percentile reached S$2,571 psf, which fits with larger units selling at the top end of the price range.
Below those top sales, Q4 2025 had a 1,410 square foot unit sell for S$3,380,000, or S$2,397 psf, on the 16th to 20th floor. Q3 2025 had a 1,227 square foot unit sell for S$3,160,000, or S$2,575 psf, on the 11th to 15th floor. The highest price per square foot in the top-five list was that Q3 2025 sale, not either of the S$3,600,000 sales. This shows that the largest total prices and the strongest per-square-foot prices are not always the same units. The floor level does not line up neatly either. A sale on the 6th to 10th floor, at S$2,518 psf, was priced higher per square foot than the sale on the 16th to 20th floor, at S$2,397 psf.
The five highest recorded resales are below.
| Quarter | Storey range | Area | Price | Per sqft |
|---|---|---|---|---|
| Q1 2026 | 16-20 | 1,399 sqft | S$3,600,000 | S$2,573 psf |
| Q1 2026 | 11-15 | 1,399 sqft | S$3,600,000 | S$2,573 psf |
| Q4 2025 | 16-20 | 1,410 sqft | S$3,380,000 | S$2,397 psf |
| Q3 2025 | 11-15 | 1,227 sqft | S$3,160,000 | S$2,575 psf |
| Q4 2025 | 06-10 | 1,227 sqft | S$3,090,000 | S$2,518 psf |
Our own estimate at this project carried a median error of 4.4% against 92 later sales
There is one more measured figure, and it is about our engine's accuracy rather than the project itself. We tested our estimates against 92 later sales at Parc Esta, as of Q4 2025. The median error was 4.4%. Only 26% of those sales fell inside the price range we had published. This second figure is the weaker of the two results. Both numbers come from testing against real past sales. They are not a valuation of any specific home at the project. Combined with the widening percentile spread seen in Q1 2026 and Q2 2026, these figures are a reminder. A project trading between S$2,149 psf and S$2,374 psf in a single quarter is harder to predict precisely than the tidy median might suggest.
Some questions remain open. The Q2 2026 resale median is lower than the two quarters before it, but this is based on only 26 sales. The size mix within any one quarter is not something the median accounts for. The next quarter's sales, broken down by size, will say more about whether this dip reflects actual price changes or simply a different mix of units sold. The rental side raises its own question. Rental contracts fell from 100 in Q4 2025 to 64 in Q2 2026, while the psf rental median stayed close to where it started. One more quarter of rental approvals would show whether this drop in volume continues. The district comparison, based on 736 sales against 109, is the more reliable of the two benchmarks here. The one-kilometre neighbour comparison is less reliable, since each of those projects has so few recorded transactions.
We often return to the same point when writing about a single project. Even a headline number built on 109 transactions rarely tells the whole story on its own. The flat eight-quarter change at Parc Esta looks like nothing has happened. But look closer. The price range has widened. The size bands line up in strict order. The number of rental contracts has fallen by half. Yet the rental price per square foot has barely moved. The real value of these numbers lies in how they fit together, and in whether the next quarter of URA caveats and rental approvals shows the same pattern.
Method: URA resale caveats at the project (developer sales and sub-sales excluded) by the quarter of the sale month; size bands by caveated floor area; rents are URA rental contracts at the project, and the gross yield is the mean of the quarterly median rents per square foot, annualised, over the four-quarter resale median per square foot, before any cost. Lease left is the tenure less the years since the lease started, as recorded. The estimate accuracy is this site's backtest: the engine run as of the quarter named, compared with the sales since. Private figures are from URA Data Service caveats, HDB figures from data.gov.sg resale records, both loaded weekly by this site's ingest. Medians are of the non-excluded transactions in the period named; sales flagged by the hygiene rules (related-party transfers, bulk deals, outliers) are left out. Every figure is indicative and drawn from recorded transactions, not a formal valuation.