Queenstown HDB Resales Hit A Median S$10,882 Psm In 2Q2026 — While The Island Median Fell 0.4%
Published 22 Sept 2026
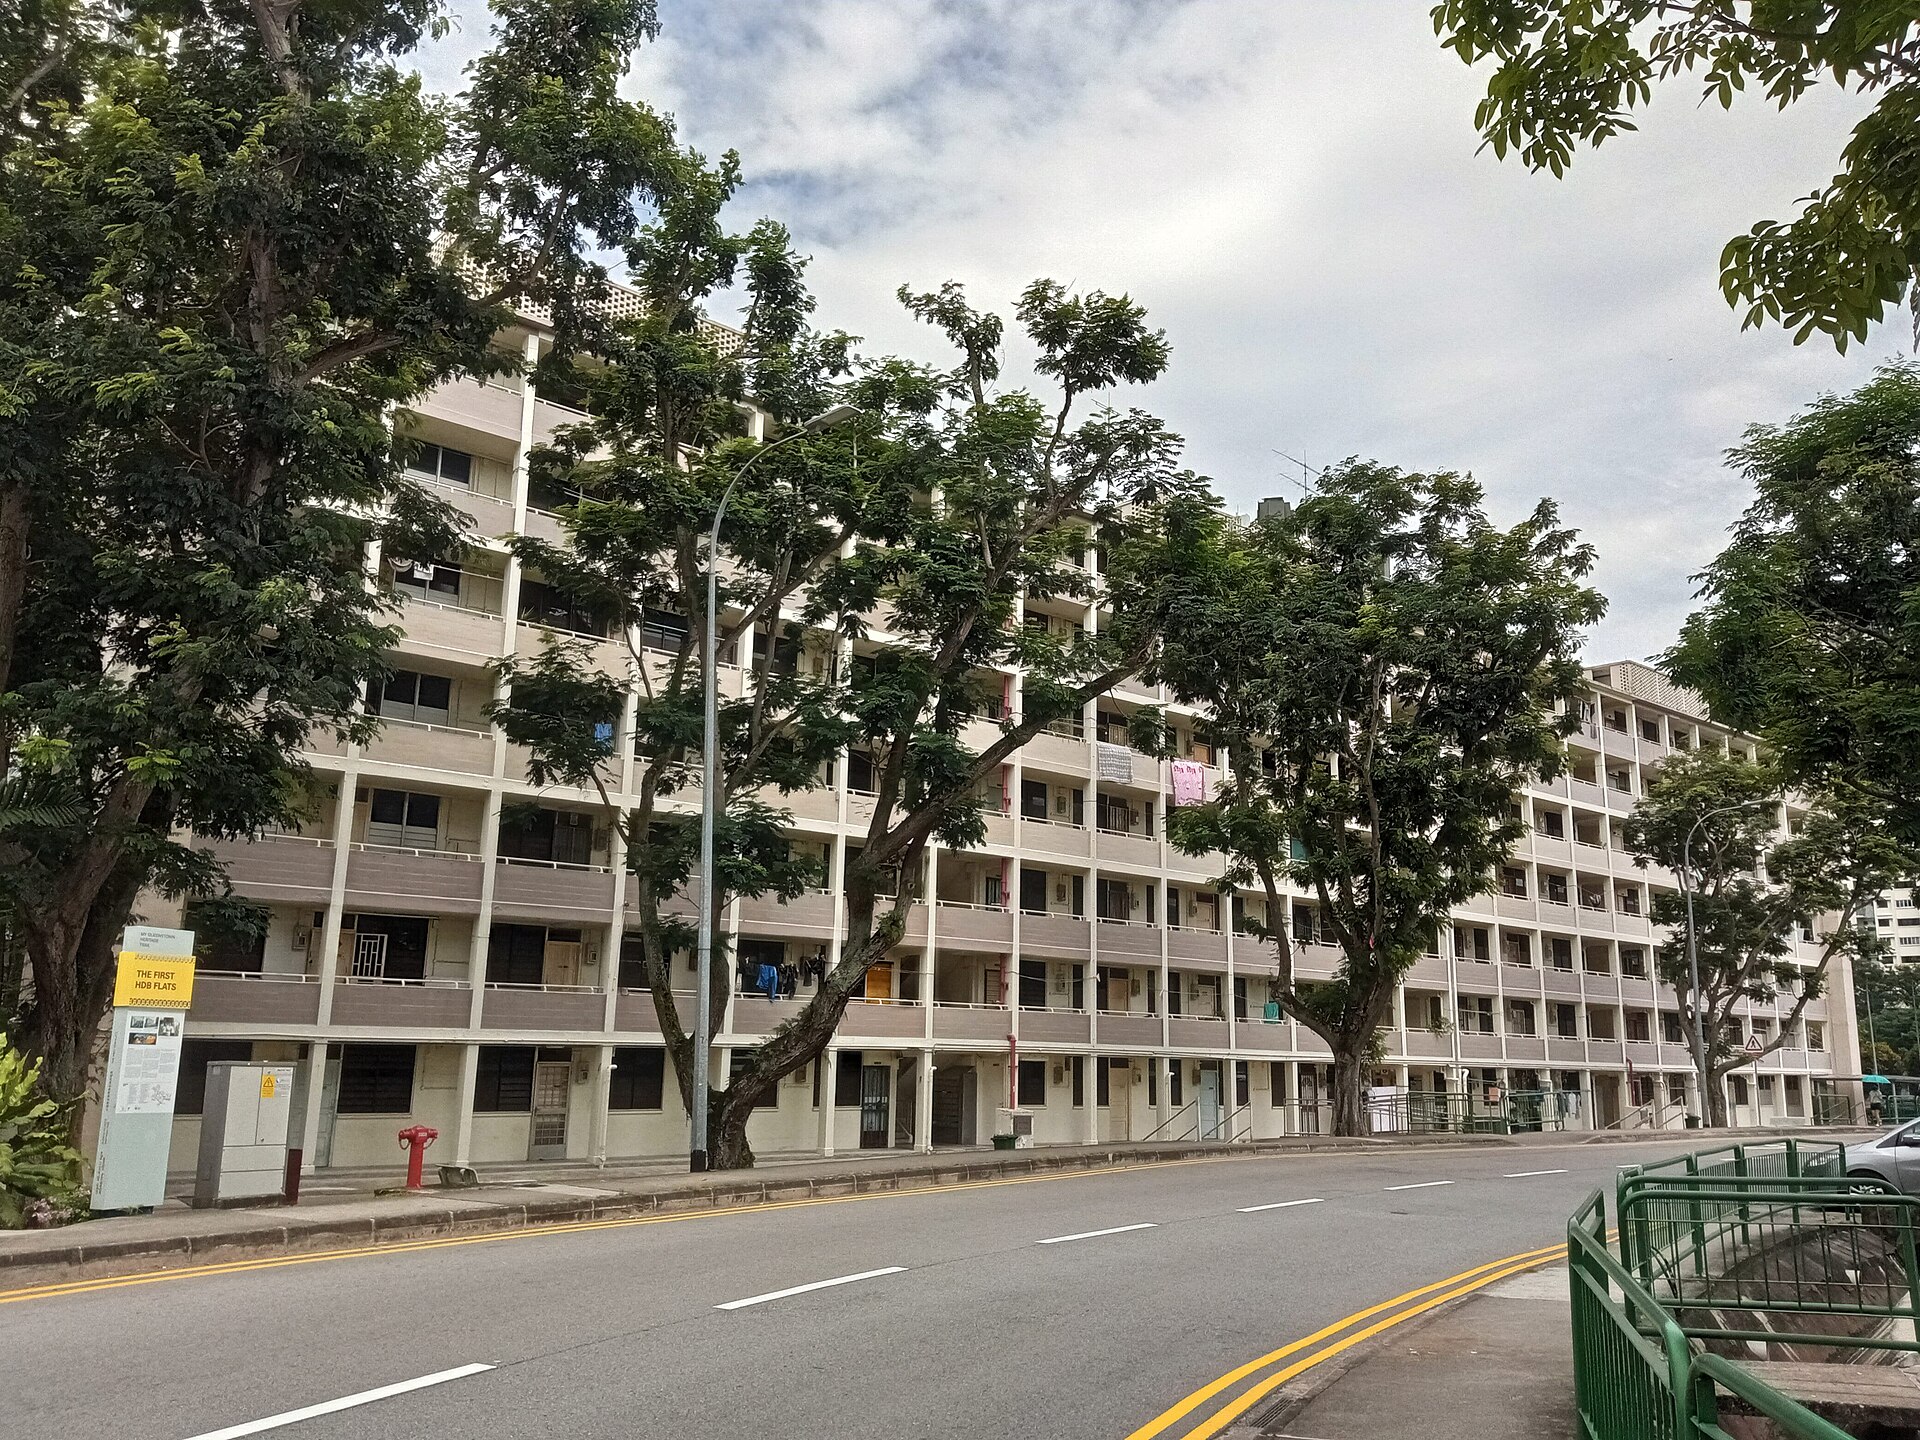
One town is moving up while the national number barely moves. This gap is worth paying attention to. For the past two years, Queenstown's resale figures have followed their own path. The latest quarter makes this gap even wider, not smaller.
According to HDB resale records published on data.gov.sg, Queenstown had 189 resale transactions in 2Q2026. The median price per square metre (psm) was S$10,882. The median price was S$855,000. This is 11.8% higher on psm and 9.1% higher on price compared with 2Q2025, when 158 flats were sold. Over the same year, the island-wide HDB resale median psm fell by 0.4%. We also looked at the town's last eight quarters, the breakdown by flat type compared with a year earlier, and the quarter's highest recorded prices. Here is what stood out to us.
Queenstown's median psm has risen in every one of the last eight quarters
Look at the quarterly table first. From Q3 2024 to Q2 2026, the town's median psm never drops. The numbers are S$7,616, S$8,403, S$9,184, S$9,730, S$10,026, S$10,099, S$10,441, then S$10,882 psm. The median price is less steady. It reads S$645,000, S$755,000, S$780,000, S$784,000, S$855,000, S$890,000, S$820,000, and S$855,000. This difference reminds us what each number measures. Median price depends on which flat types and sizes were sold in that quarter. Median psm adjusts for floor area, so it removes that effect. When the two move in different ways, the mix of flats sold is usually the reason. The table alone cannot tell us how much of the change comes from that mix.
The count of million-dollar flats moves in the same direction. Sixty-two of the quarter's resales sold for S$1 million or more. This compares with 47 in 2Q2025 and 32 in Q3 2024. Sales counts dropped to 130 in Q4 2025. They then climbed back to 175 and 189 in the two quarters since. These are counts of actual completed sales, not listings or asking prices. Every median here reflects what was actually sold, not any official valuation.
| Quarter | Median psm | Median price | Sales | At S$1m or more |
|---|---|---|---|---|
| Q3 2024 | S$7,616 psm | S$645,000 | 203 | 32 |
| Q4 2024 | S$8,403 psm | S$755,000 | 143 | 32 |
| Q1 2025 | S$9,184 psm | S$780,000 | 155 | 41 |
| Q2 2025 | S$9,731 psm | S$784,000 | 158 | 47 |
| Q3 2025 | S$10,026 psm | S$855,000 | 138 | 38 |
| Q4 2025 | S$10,099 psm | S$890,000 | 130 | 43 |
| Q1 2026 | S$10,441 psm | S$820,000 | 175 | 53 |
| Q2 2026 | S$10,882 psm | S$855,000 | 189 | 62 |
The climb since Q3 2024 adds up to +42.9% on a per-square-metre basis
When drawn as a line, the eight quarters show the pattern more clearly than the table. The steepest rise happens early, between Q3 2024 and 2Q2025. After that, the line flattens noticeably, showing S$10,026 psm and then S$10,099 psm across Q3 and Q4 2025. The two most recent quarters show the rise picking up again. From start to end of this period, starting at S$7,616 psm on 203 sales, the town's median psm has risen by 42.9%.
The number of sales behind each point is an important caveat. Quarterly sales volumes in Queenstown range from 130 to 203 across this period. This means a few unusual sales can shift the numbers for a single quarter, especially in smaller flat-type groups. The flattening seen in the second half of 2025 lines up with the two lowest sales counts in the series. The chart shows this pattern, but it cannot explain the cause on its own. What the chart does confirm is the direction: eight quarters in a row without a fall in the median psm.
Not every flat type in Queenstown moved at the same pace
When split by flat type, the year-on-year picture is mixed. Three-room flats had a median price of S$480,000 in 2Q2026, across 89 sales. This is up 7.9% from S$445,000 a year earlier. Four-room flats had a median of S$1,023,000, based on 73 sales. This is a change of 2.8% from S$995,000. Five-room flats recorded a median of S$1,258,000, based on 23 sales. This is up 5.7% from S$1,190,000. The biggest percentage increase belongs to the smallest and cheapest flat type. The four-room median, already above S$1 million, changed the least in percentage terms.
The psm figures put things in a different order. Four-room flats have the highest median at S$11,566 psm. This is ahead of five-room flats at S$10,403 psm and three-room flats at S$7,692 psm. It is common for larger flats to have a lower price per square metre. This pattern explains why the town's overall median price can move around while the median psm keeps rising. The 23 five-room sales are a small sample. A quarter with so few sales can show more random variation than the 89 three-room sales next to it.
| Flat type | Median price Q2 2026 | Median psm | Sales | Median price Q2 2025 | Change |
|---|---|---|---|---|---|
| Queenstown 3-room | S$480,000 | S$7,692 psm | 89 | S$445,000 | +7.9% |
| Queenstown 4-room | S$1,023,000 | S$11,566 psm | 73 | S$995,000 | +2.8% |
| Queenstown 5-room | S$1,258,000 | S$10,403 psm | 23 | S$1,190,000 | +5.7% |
Every one of the quarter's five highest prices was a 5-room flat
The highest prices in the table are concentrated in a few flat types and addresses. The quarter's highest recorded price in Queenstown was S$1,650,000, for a 5-room flat at Blk 93 Dawson Rd. This flat is 122 square metres, on the 04 to 06 storey range, priced at S$13,525 psm, with 89 years of lease remaining. Next is Blk 79 Dawson Rd at S$1,550,000, a 107 square metre unit on the 25 to 27 storeys. This works out to the highest rate in the group, at S$14,486 psm. Two Ghim Moh Link transactions follow, at S$1,480,000 and S$1,450,000.
The storey ranges show that the highest price and the highest psm do not belong to the same flat. The S$1,650,000 sale is the largest flat at 122 square metres, but it is on a low floor. The two Blk 79 Dawson Rd entries, at S$14,486 psm and S$13,439 psm, are smaller units on higher floors. Lease remaining across these five flats ranges from 86 to 94 years. These are five recorded transactions out of 189 total. They describe the top end of the quarter, not the whole town.
| Block | Flat type | Storey range | Area | Price | Per sqm | Lease left (years) |
|---|---|---|---|---|---|---|
| Blk 93 Dawson Rd | 5-room | 04 TO 06 | 122 sqm | S$1,650,000 | S$13,525 psm | 89 |
| Blk 79 Dawson Rd | 5-room | 25 TO 27 | 107 sqm | S$1,550,000 | S$14,486 psm | 93 |
| Blk 22 Ghim Moh Link | 5-room | 37 TO 39 | 113 sqm | S$1,480,000 | S$13,097 psm | 86 |
| Blk 22 Ghim Moh Link | 5-room | 40 TO 42 | 113 sqm | S$1,450,000 | S$12,832 psm | 86 |
| Blk 79 Dawson Rd | 5-room | 19 TO 21 | 107 sqm | S$1,438,000 | S$13,439 psm | 94 |
A few questions remain open. The gap between Queenstown's 11.8% rise in psm and the island-wide 0.4% fall is measured over just one year. The town's own numbers show two quarters in late 2025 where the median psm stayed close to flat. So the pace of change has not been steady throughout. The mix of flats sold remains the main unknown. With 89 three-room sales and 23 five-room sales in the quarter, the types of flats sold can move the headline median price without the underlying psm changing much. The next quarter's data will show whether sales volumes stay near the 175 to 189 range seen in the past two quarters. It will also show whether the count of sales at S$1 million or more keeps rising, following the pattern from 32 up to 62.
We keep returning to the same point with town-level numbers. One median, on its own, is just a snapshot of whatever flats happened to be sold in three months. It becomes useful when compared against the eight quarters before it, the flat types within it, and the national figure it is measured against. On all three counts, Queenstown in 2Q2026 looks different from the wider HDB resale market. That is the part of this data worth remembering.
Method: HDB resale records grouped by town and by the quarter of the sale month; medians are of price and of price per square metre. Flat types with fewer than five sales in the quarter are omitted from the breakdown. Lease left is rounded to whole years as at the sale. Private figures are from URA Data Service caveats, HDB figures from data.gov.sg resale records, both loaded weekly by this site's ingest. Medians are of the non-excluded transactions in the period named; sales flagged by the hygiene rules (related-party transfers, bulk deals, outliers) are left out. Every figure is indicative and drawn from recorded transactions, not a formal valuation.