One Marina Gardens reaches 560 units sold at a median of S$2,966 psf as of August 2026
Published 23 Sept 2026 · One Marina Gardens
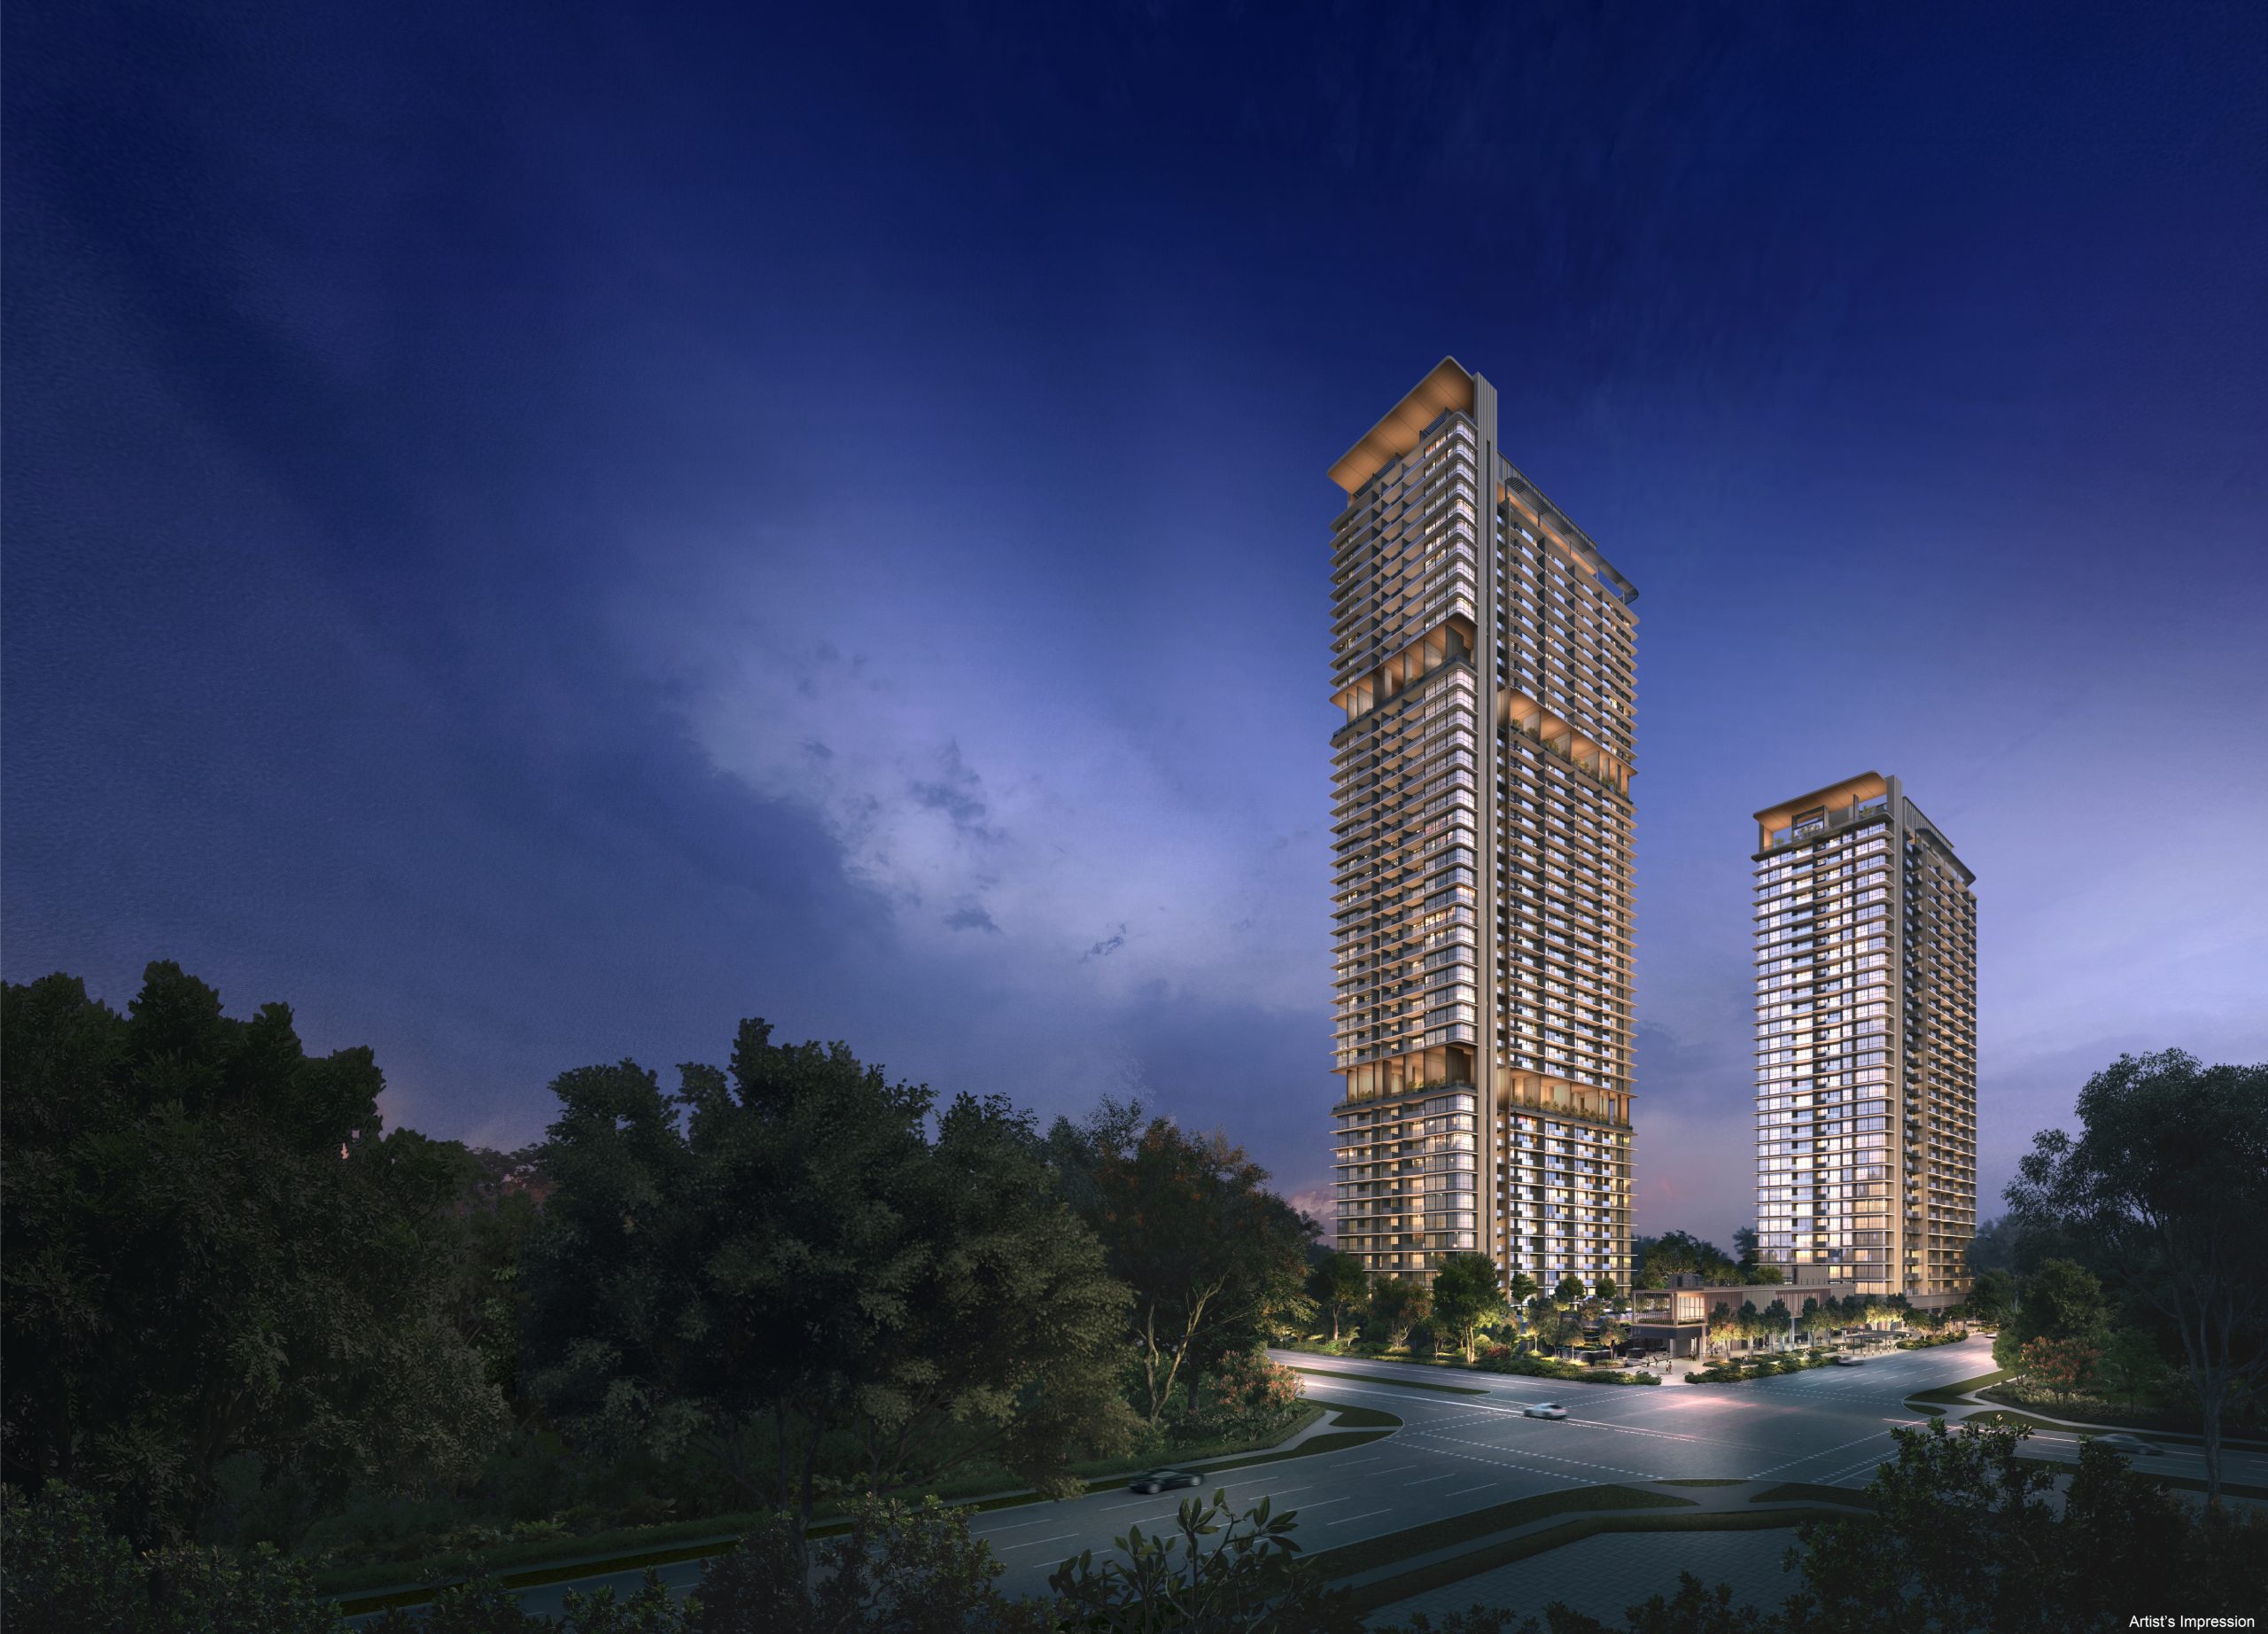
One Marina Gardens has recorded 560 developer sales since April 2025 at an overall median of S$2,966 psf. That is 59.8% of the 937-unit project, with 26 of those caveats lodged in the three months to August 2026.
The busiest month remains April 2025, the first month of sales, with 295 caveats. The monthly median moved from S$2,957 psf then to S$3,082 psf in August 2026, a rise of 4.2%, based on caveats lodged with the URA Data Service.
The 99-year leasehold project in District 1 is developed by Kingsford Development, according to the developer's website.
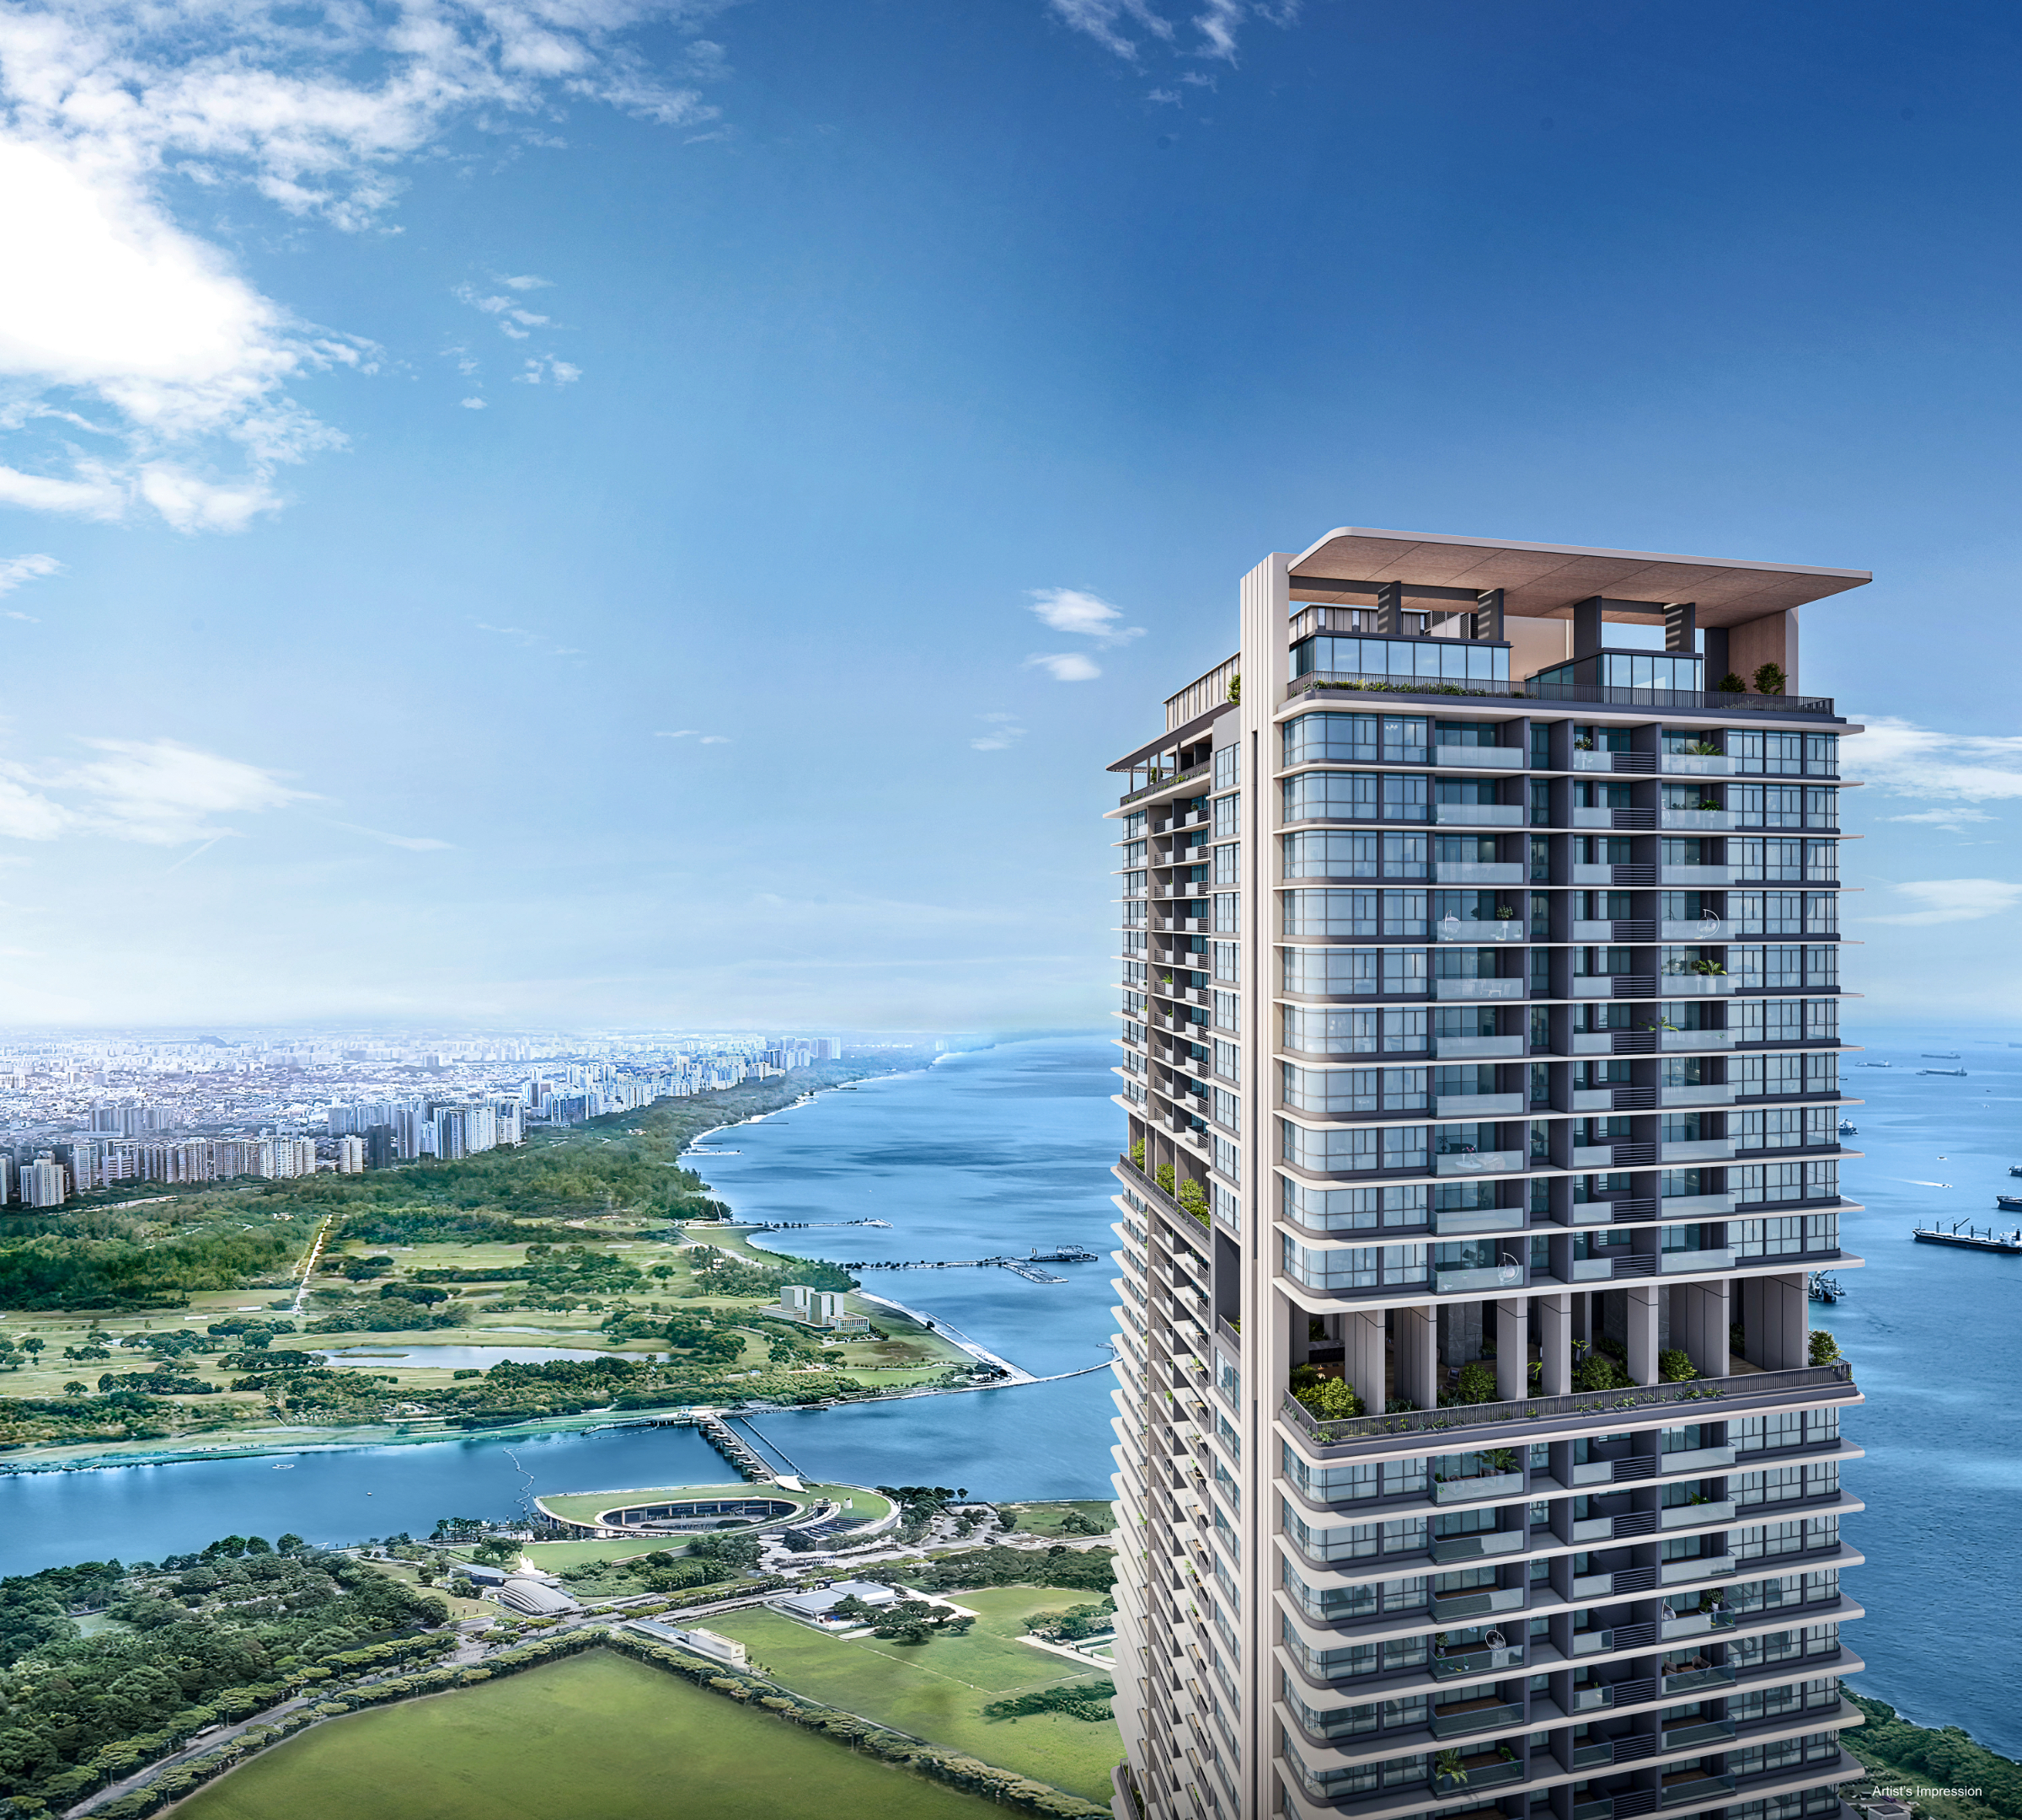
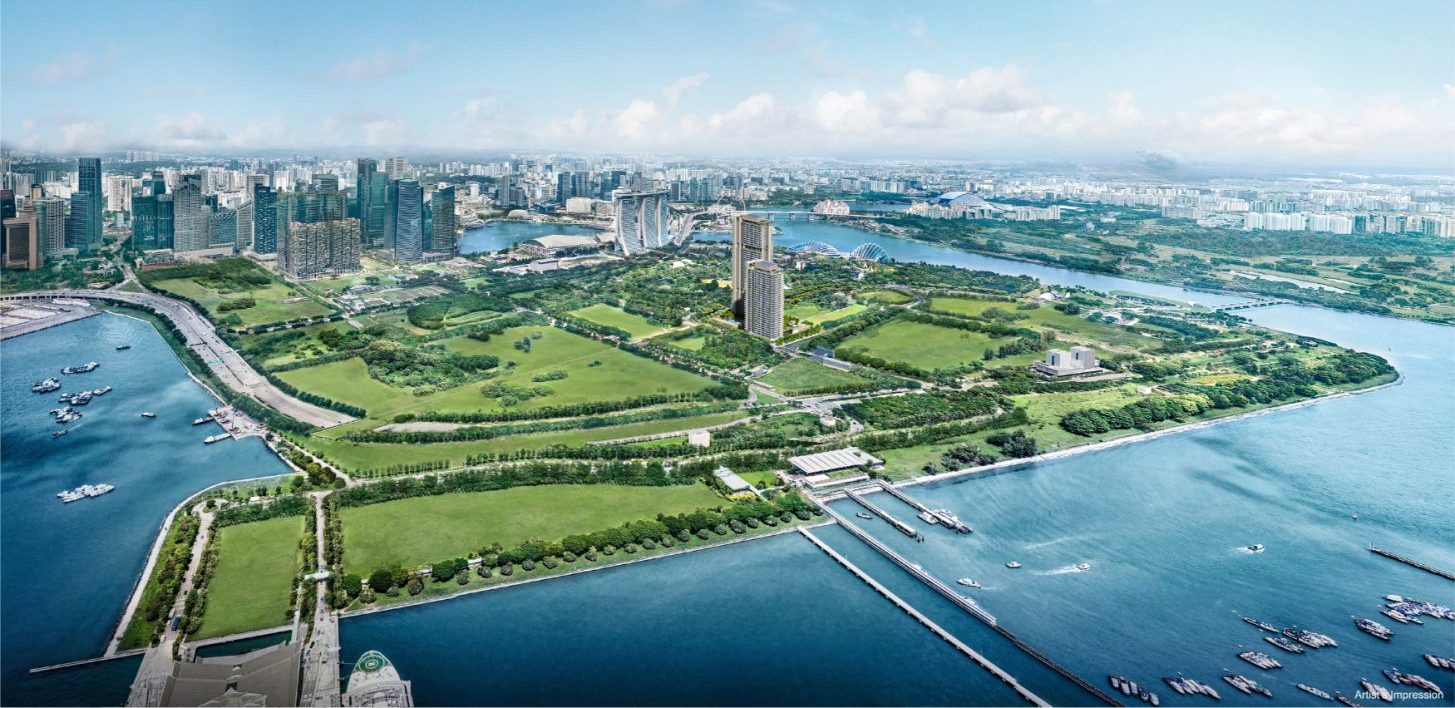
Sales pace after the launch month
After April 2025, monthly caveats fell to 57 in May 2025 and 44 in June 2025. The count dropped to five in December 2025 and four in June 2026.
Activity picked up again in April 2026 with 24 caveats, followed by 18 in May 2026 and 17 in July 2026. Five caveats were lodged in August 2026, at a monthly median of S$3,082 psf, the highest monthly median in the table below.
| Month | Caveats | Cumulative | Median psf |
|---|---|---|---|
| April 2025 | 295 | 295 | S$2,957 psf |
| May 2025 | 57 | 352 | S$2,974 psf |
| June 2025 | 44 | 396 | S$2,962 psf |
| July 2025 | 20 | 416 | S$2,965 psf |
| August 2025 | 8 | 424 | S$2,918 psf |
| September 2025 | 7 | 431 | S$2,894 psf |
| October 2025 | 6 | 437 | S$2,960 psf |
| November 2025 | 16 | 453 | S$3,019 psf |
| December 2025 | 5 | 458 | S$3,047 psf |
| January 2026 | 12 | 470 | S$2,999 psf |
| February 2026 | 11 | 481 | S$2,989 psf |
| March 2026 | 11 | 492 | S$2,933 psf |
| April 2026 | 24 | 516 | S$2,979 psf |
| May 2026 | 18 | 534 | S$2,975 psf |
| June 2026 | 4 | 538 | S$2,990 psf |
| July 2026 | 17 | 555 | S$3,028 psf |
| August 2026 | 5 | 560 | S$3,082 psf |
Units of 50 to 69 sqm were the most sold
The 50 to 69 sqm band accounts for 259 of the 560 caveats. Its median area is 678 sqft and its median price S$2,046,300, or S$2,994 psf.
Units under 50 sqm follow with 170 caveats at a median price of S$1,251,825. The 120 sqm and above band has 16 caveats at a median of S$4,962,769, the highest median psf of the five bands at S$3,013 psf.
| Size band | Caveats | Median area | Median price | Median psf |
|---|---|---|---|---|
| under 50 sqm | 170 | 431 sqft | S$1,251,825 | S$2,943 psf |
| 50 to 69 sqm | 259 | 678 sqft | S$2,046,300 | S$2,994 psf |
| 70 to 89 sqm | 20 | 904 sqft | S$2,672,292 | S$2,956 psf |
| 90 to 119 sqm | 95 | 1,012 sqft | S$3,061,100 | S$2,960 psf |
| 120 sqm and above | 16 | 1,647 sqft | S$4,962,769 | S$3,013 psf |
Launch median is 29.3% above nearby resales
Within 1,000 m, 31 resales were recorded over the 24 months to August 2026, all in one completed project. The median for those resales was S$2,294 psf.
The launch median of S$2,966 psf is 29.3% above that figure. The comparison covers a single project, Marina Bay Residences, 981 m away, as the table below shows.
| Project | Tenure | TOP | Distance | Resales | Median psf |
|---|---|---|---|---|---|
| Marina Bay Residences | 99-year leasehold | — | 981 m | 31 | S$2,294 psf |
How other District 1 launches sold
Among other launches in the district over the 12 months to August 2026, Union Square Residences recorded the most caveats at 81, at a median of S$2,800 psf.
W Residences Marina View - Singapore logged 13 caveats at a median of S$2,660 psf. Skywaters Residences logged four caveats at a median of S$5,914 psf, a count too small to read as a market level.
| Project | Tenure | Expected TOP | Caveats | Median psf |
|---|---|---|---|---|
| Union Square Residences | 99-year leasehold | — | 81 | S$2,800 psf |
| W Residences Marina View - Singapore | 99-year leasehold | — | 13 | S$2,660 psf |
| Skywaters Residences | 99-year leasehold | — | 4 | S$5,914 psf |
One Marina Gardens has been selling for 17 months. The 26 caveats in the three months to August 2026 lift the cumulative total to 560 units, leaving 59.8% of the project sold on the caveat record.
Method: URA caveats for developer sales ('new sale') at the project, dated to the month. Size bands by the caveated floor area. The nearby comparison is resale caveats in completed projects within one kilometre over 24 months, unadjusted for size, age or floor. Units sold is the caveat count, which lags option exercises by weeks. Private figures are from URA Data Service caveats, HDB figures from data.gov.sg resale records, both loaded weekly by this site's ingest. Medians are of the non-excluded transactions in the period named. Sales flagged by the hygiene rules (related-party transfers, bulk deals, outliers) are left out. Every figure is indicative and drawn from recorded transactions, not a formal valuation. Facilities, layouts and photographs, where shown, are as supplied by the developer or seen on our own visit, and are not engine data.