Bukit Merah's HDB Resale Median Is Down 4.5% On The Year — Yet 56 Flats Still Crossed S$1 Million In 2Q2026
Published 24 Sept 2026
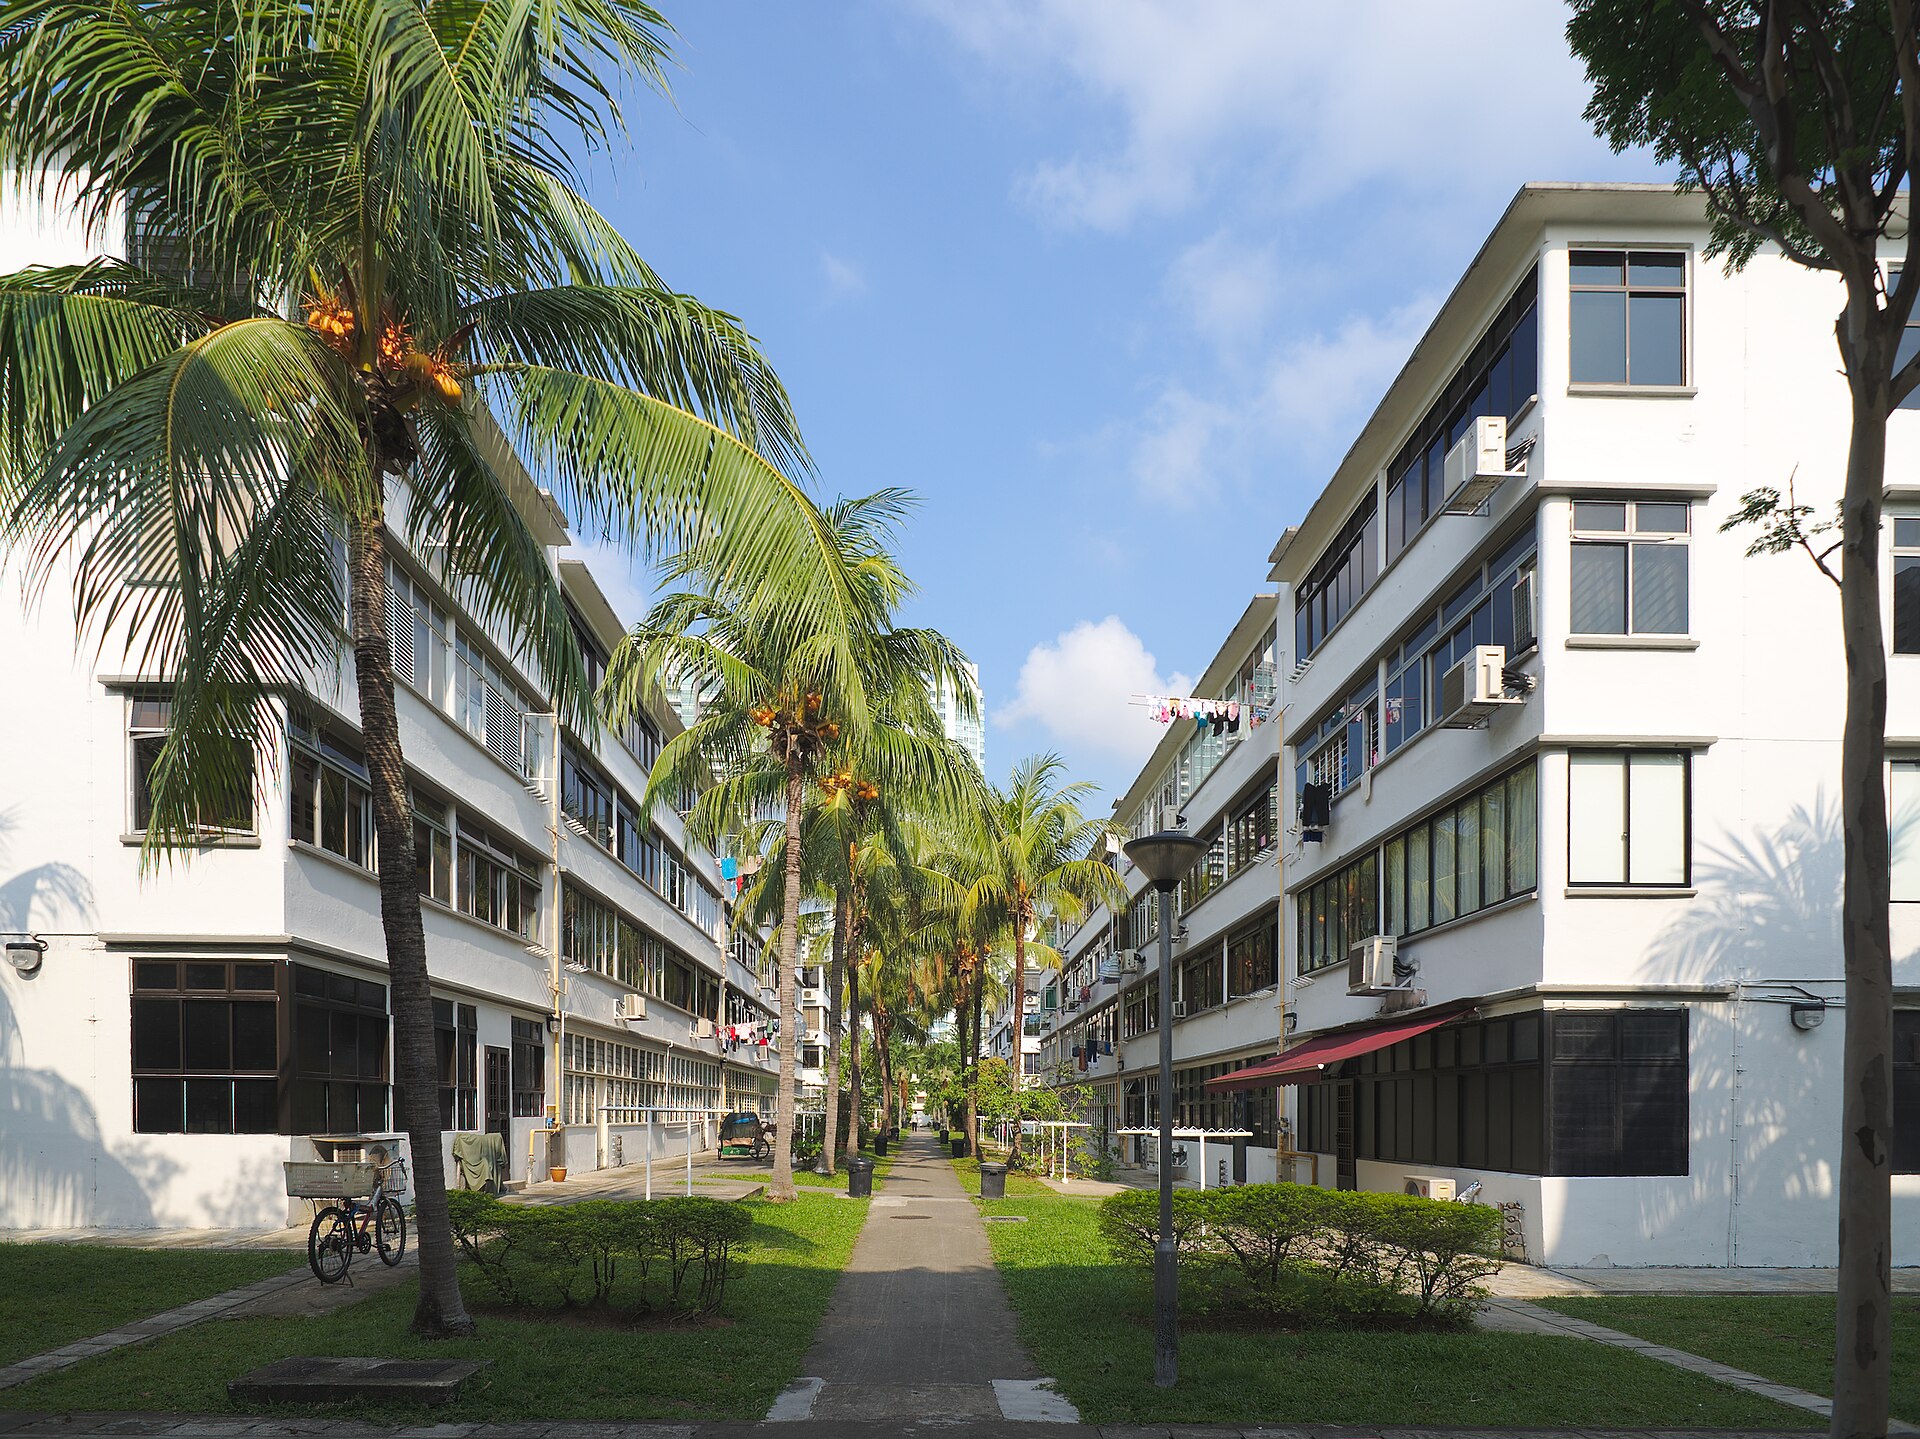
Bukit Merah looks like two stories at once this quarter. The yearly comparison is down. The quarter-on-quarter one is up. And the million-dollar tally has not budged from where it was a year ago.
According to HDB resale records on data.gov.sg, Bukit Merah recorded 238 resales in 2Q2026. The median worked out to S$8,637 psm, with a median price of S$786,500. Against 2Q2025, that is -4.5% on psm and -1.7% on price, from a base of 244 sales. Island-wide, the HDB resale median psm moved -0.4% over the same year. So the town moved down by more than the national figure did. Everything here is a median drawn from recorded transactions. None of it is a valuation of any particular flat.
The median psm is well below last year's peak, but above where it sat last quarter
Eight quarters of data give the year-on-year drop some context. The town's high point in this window was 2Q2025, at S$9,045 psm. The low point was 1Q2026, at S$8,366 psm. This quarter's S$8,637 psm sits between the two.
Stretch the line back further and the net move is small. Since 3Q2024, when the median was S$8,800 psm on 263 sales, the town's median psm has moved -1.8%. That is a smaller shift than the year-on-year number suggests on its own. It depends heavily on which quarter you pick as the starting point.
One thing the chart cannot settle is mix. A quarterly median moves when the blend of flat types, floors and lease lengths changes, not only when prices do. With a few hundred sales a quarter, that blend can shift quite a bit. The chart below tracks the median psm by quarter, with the sale count for each point.
Volume has returned to roughly where it was a year ago, and so has the million-dollar count
The 238 sales in 2Q2026 follow 214 in 1Q2026 and 176 in 4Q2025. The 4Q2025 figure is the thinnest in the eight quarters shown. Volume has since climbed back towards the levels seen through 2024 and early 2025.
The million-dollar column is the one we kept coming back to. Bukit Merah recorded 56 resales at S$1 million or more in 2Q2026. A year earlier, in 2Q2025, the count was also 56. The peak in this window was 3Q2025, at 61. The low was 4Q2024, at 37.
So the upper end of the town held its count steady, even as the median psm fell over the year. That points to a market where the two ends are not moving in step. The table below sets out median psm, median price, sales and the million-dollar count for each of the last eight quarters.
| Quarter | Median psm | Median price | Sales | At S$1m or more |
|---|---|---|---|---|
| Q3 2024 | S$8,800 psm | S$780,000 | 263 | 45 |
| Q4 2024 | S$8,500 psm | S$738,000 | 221 | 37 |
| Q1 2025 | S$8,976 psm | S$761,000 | 236 | 53 |
| Q2 2025 | S$9,045 psm | S$800,000 | 244 | 56 |
| Q3 2025 | S$8,588 psm | S$800,000 | 234 | 61 |
| Q4 2025 | S$8,670 psm | S$780,000 | 176 | 44 |
| Q1 2026 | S$8,366 psm | S$772,500 | 214 | 52 |
| Q2 2026 | S$8,637 psm | S$786,500 | 238 | 56 |
Not every flat type moved in the same direction over the year
Splitting the quarter by flat type shows how uneven the year-on-year picture is. 4-room flats, the largest group at 101 sales, had a median price of S$938,000. A year earlier it was S$939,000, a change of -0.1%. That is close to flat.
5-room flats tell a different story. Their median came in at S$991,000 across 46 sales, against S$1,100,000 in 2Q2025. That is -9.9%, the steepest fall of the four types. 2-room flats were down 7.6%, from S$320,500 to S$296,000, but on only 10 sales. At that count, a handful of deals can shift the median.
3-room flats, with 77 sales, moved -1.6% to S$438,000. On a psm basis, 4-room flats led at S$10,086 psm, ahead of 5-room at S$8,587 psm. The table below sets out each type against its year-ago median.
| Flat type | Median price Q2 2026 | Median psm | Sales | Median price Q2 2025 | Change |
|---|---|---|---|---|---|
| Bukit Merah 2-room | S$296,000 | S$6,879 psm | 10 | S$320,500 | -7.6% |
| Bukit Merah 3-room | S$438,000 | S$6,567 psm | 77 | S$445,000 | -1.6% |
| Bukit Merah 4-room | S$938,000 | S$10,086 psm | 101 | S$939,000 | -0.1% |
| Bukit Merah 5-room | S$991,000 | S$8,587 psm | 46 | S$1,100,000 | -9.9% |
The quarter's highest price came from a low floor, not a high one
The top sale in Bukit Merah this quarter was S$1,530,000, at Blk 50 Moh Guan Ter. It was a 4-room flat of 150 sqm on the 01 TO 03 storey range, with 46 years of lease left. That works out to S$10,200 psm, the lowest psm of the five top sales.
The rest of the list runs the other way. Blk 10A Boon Tiong Rd took S$1,310,000 for a 92 sqm 4-room flat on the 25 TO 27 range, at S$14,239 psm with 89 years left. Blk 9A Boon Tiong Rd reached S$1,500,000 at S$13,393 psm, also with 89 years left.
So the highest price and the highest psm came from different flats. Area and lease length both sit behind that gap. The table below lists the five highest-priced resales in the town for the quarter.
| Block | Flat type | Storey range | Area | Price | Per sqm | Lease left (years) |
|---|---|---|---|---|---|---|
| Blk 50 Moh Guan Ter | 4-room | 01 TO 03 | 150 sqm | S$1,530,000 | S$10,200 psm | 46 |
| Blk 9A Boon Tiong Rd | 5-room | 07 TO 09 | 112 sqm | S$1,500,000 | S$13,393 psm | 89 |
| Blk 6A Boon Tiong Rd | 5-room | 10 TO 12 | 115 sqm | S$1,380,000 | S$12,000 psm | 79 |
| Blk 20 Jln Membina | 5-room | 25 TO 27 | 110 sqm | S$1,320,000 | S$12,000 psm | 76 |
| Blk 10A Boon Tiong Rd | 4-room | 25 TO 27 | 92 sqm | S$1,310,000 | S$14,239 psm | 89 |
The figures leave a few things open. 1Q2026 recorded S$8,366 psm. 2Q2026 came in higher. Whether that is a turn or just quarter-to-quarter noise is not something two data points can settle. The 5-room decline of 9.9% is the other open question. It rests on 46 sales, so mix could account for part of it. Next quarter's data will show whether the 4-room median holds near S$938,000, and whether the million-dollar count stays around the mid-fifties.
A single headline number rarely carries a town on its own. Here the median fell on the year, volume recovered, and the top end held its count. Those three facts sit in the same dataset and do not contradict each other. The value is in reading them together, and against where the rest of the island moved.
Method: HDB resale records grouped by town and by the quarter of the sale month. Medians are of price and of price per square metre. Flat types with fewer than five sales in the quarter are omitted from the breakdown. Lease left is rounded to whole years as at the sale. Private figures are from URA Data Service caveats, HDB figures from data.gov.sg resale records, both loaded weekly by this site's ingest. Medians are of the non-excluded transactions in the period named. Sales flagged by the hygiene rules (related-party transfers, bulk deals, outliers) are left out. Every figure is indicative and drawn from recorded transactions, not a formal valuation.