Riverfront Residences Sold 99 Units At A Median Of S$1,744 psf — And Every Project Within 1 km Sold For Less
Published 23 Sept 2026 · Riverfront Residences
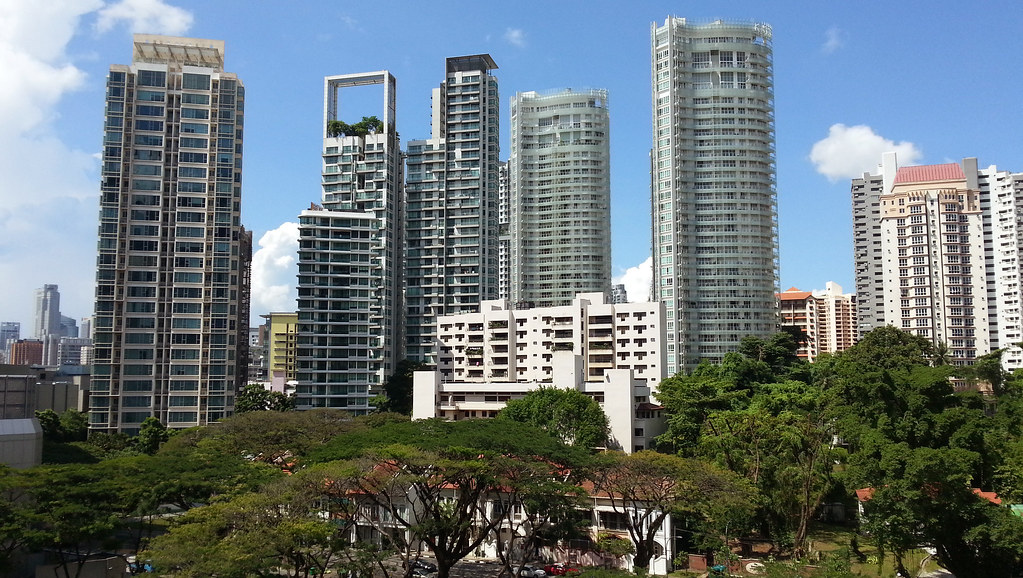
Most project write-ups are about a price that moved. This one is mostly about a gap that held. Riverfront Residences has spent the last seven quarters trading inside a fairly tight band, while the projects around it have traded several hundred dollars per square foot below it.
According to URA Data Service caveats, Riverfront Residences recorded 99 resales over 3Q2025 to 2Q2026 at a median of S$1,744 psf. Over the same four quarters, District 19 as a whole recorded 2,311 resales at a median of S$1,644 psf, which puts the project 6.1% above its district. It is a 99-year leasehold apartment project in the OCR with 91 years of lease left. We pulled the quarterly medians, the size bands, the rental contracts and the neighbours within 1 km, and here's what stood out to us.
The quarterly median has stayed inside a narrow band since 4Q2024
Across the seven quarters shown, the median moved +6.2%, from S$1,671 psf in 4Q2024 to S$1,775 psf in 2Q2026. That is the full distance between the first and last points. In between, the line does not climb steadily. It reached S$1,778 psf as early as 2Q2025, then eased to S$1,738 psf and S$1,726 psf in the two quarters after, before returning to S$1,747 psf in 1Q2026.
Volumes shift enough to matter when you read those moves. The quarters with 31 sales, 2Q2025 and 2Q2026, sit at the top of the range. The quarter with 19 sales, 1Q2026, sits in the middle. With counts this size, a quarter's mix of stacks, floors and unit sizes can shift the median without any change in what a comparable unit fetches.
The quartiles are worth a look too. In 3Q2025 the 25th and 75th percentiles were S$1,709 psf and S$1,762 psf. In 2Q2026 they were S$1,656 psf and S$1,849 psf. The middle of the market landed in much the same place, but the spread around it was wider.
The table and chart below show the quarterly picture.
| Quarter | Resales | Median psf | 25th percentile | 75th percentile |
|---|---|---|---|---|
| Q4 2024 | 22 | S$1,671 psf | S$1,603 psf | S$1,723 psf |
| Q1 2025 | 20 | S$1,699 psf | S$1,638 psf | S$1,757 psf |
| Q2 2025 | 31 | S$1,778 psf | S$1,695 psf | S$1,803 psf |
| Q3 2025 | 23 | S$1,738 psf | S$1,709 psf | S$1,762 psf |
| Q4 2025 | 26 | S$1,726 psf | S$1,694 psf | S$1,799 psf |
| Q1 2026 | 19 | S$1,747 psf | S$1,639 psf | S$1,771 psf |
| Q2 2026 | 31 | S$1,775 psf | S$1,656 psf | S$1,849 psf |
The larger units here carry the higher psf, not the smaller ones
The usual pattern in a project like this is for compact units to print the highest psf. That is not what the last four quarters show. The 90 to 119 sqm band recorded 16 resales at a median of S$2,019,444, or S$1,853 psf, the highest median psf of any band. The 120 sqm and above band, on six resales, came in at S$1,830 psf with a median price of S$2,810,000.
At the other end, the under 50 sqm band recorded 25 resales at a median of S$806,800, or S$1,620 psf. That is the lowest median psf in the table, on the largest count outside the mid-sized band.
The 50 to 69 sqm band was the most traded size, with 34 resales at a median of S$1,105,000, or S$1,759 psf. Six sales in the largest band is a thin base, so that figure carries less weight than the ones above it. The bands also mix floors and facings, which the table cannot separate out.
| Size band | Resales | Median area | Median price | Median psf |
|---|---|---|---|---|
| under 50 sqm | 25 | 517 sqft | S$806,800 | S$1,620 psf |
| 50 to 69 sqm | 34 | 614 sqft | S$1,105,000 | S$1,759 psf |
| 70 to 89 sqm | 18 | 915 sqft | S$1,566,944 | S$1,745 psf |
| 90 to 119 sqm | 16 | 1,109 sqft | S$2,019,444 | S$1,853 psf |
| 120 sqm and above | 6 | 1,485 sqft | S$2,810,000 | S$1,830 psf |
Rents held flat over four quarters while the number of contracts drifted down
The rental side is the steadiest part of this data pack. Median rent per square foot a month reads 5.2, 5.1, 5.1 and 5.2 across 3Q2025 to 2Q2026. Median monthly rent alternates between S$2,900 and S$3,100 over the same stretch. Whatever the resale median was doing, the rental median barely moved.
Contract counts did move. There were 89 contracts in 3Q2025, 79 in 4Q2025, 87 in 1Q2026 and 74 in 2Q2026. These are URA rental approvals for the project, so they count leases signed in the quarter, not units occupied.
Putting 2Q2026's median rent of S$2,900 against the resale median gives a gross yield of about 3.5% on our own engine's calculation. That is before any costs, and it pairs a rental median and a sale median drawn from different sets of units. Treat it as an indicative figure from recorded transactions, not a valuation of any particular home.
| Quarter | Contracts | Median rent (S$ psf a month) | Median monthly rent |
|---|---|---|---|
| Q3 2025 | 89 | 5.2 | S$2,900 |
| Q4 2025 | 79 | 5.1 | S$3,100 |
| Q1 2026 | 87 | 5.1 | S$3,100 |
| Q2 2026 | 74 | 5.2 | S$2,900 |
All eight projects within 1 km transacted below Riverfront Residences
Within 1 km, eight projects recorded resales over 3Q2025 to 2Q2026, and every one of them has a lower median psf. The closest in price is Riversails, 686 m away, at S$1,478 psf on 33 resales. Kingsford Waterbay, just 255 m away, recorded the largest count in the group, 54 resales, at S$1,467 psf.
Below that the range opens up. Boathouse Residences at 476 m recorded 21 resales at S$1,430 psf, Heron Bay at 553 m recorded 20 at S$1,394 psf, and Austville Residences at 900 m recorded 38 at S$1,370 psf. The lowest medians in the group are Rio Vista at S$1,225 psf, Park Green at S$1,157 psf and The Florida at S$1,107 psf.
Every project in the table is 99-year leasehold, so tenure alone does not explain the spread. Age does not appear in this pack, and the table does not hold unit mix constant either. What it shows is the gap, not the reason for it.
The neighbour comparison sits below.
| Project | Tenure | TOP | Distance | Resales | Median psf |
|---|---|---|---|---|---|
| Kingsford Waterbay | 99-year leasehold | — | 255 m | 54 | S$1,467 psf |
| Austville Residences | 99-year leasehold | — | 900 m | 38 | S$1,370 psf |
| Riversails | 99-year leasehold | — | 686 m | 33 | S$1,478 psf |
| Rio Vista | 99-year leasehold | — | 208 m | 23 | S$1,225 psf |
| Boathouse Residences | 99-year leasehold | — | 476 m | 21 | S$1,430 psf |
| Heron Bay | 99-year leasehold | — | 553 m | 20 | S$1,394 psf |
| Park Green | 99-year leasehold | — | 995 m | 12 | S$1,157 psf |
| The Florida | 99-year leasehold | — | 209 m | 10 | S$1,107 psf |
The five largest resales cluster on just two unit sizes
The top of the price range at Riverfront Residences is narrow. All five of the highest resales over the window came from units of either 1,679 sqft or 1,485 sqft. The highest was S$2,980,000 in 1Q2026, a 1,679 sqft unit on the 11 to 15 storey range at S$1,775 psf. A 1,679 sqft unit on the 06 to 10 range had fetched S$2,960,000 in 3Q2025, at S$1,763 psf.
The psf column runs the other way from the price column. The three 1,485 sqft transactions all priced higher per square foot than the two larger ones. A 1,485 sqft unit on the 01 to 05 range went for S$2,820,000 in 1Q2026, or S$1,898 psf, and two more at S$2,800,000 printed S$1,885 psf in 4Q2025 and 2Q2026.
Five caveats are a small set, and floor ranges here span low and mid floors alike. The table below lists them in full.
| Quarter | Storey range | Area | Price | Per sqft |
|---|---|---|---|---|
| Q1 2026 | 11-15 | 1,679 sqft | S$2,980,000 | S$1,775 psf |
| Q3 2025 | 06-10 | 1,679 sqft | S$2,960,000 | S$1,763 psf |
| Q1 2026 | 01-05 | 1,485 sqft | S$2,820,000 | S$1,898 psf |
| Q4 2025 | 06-10 | 1,485 sqft | S$2,800,000 | S$1,885 psf |
| Q2 2026 | 01-05 | 1,485 sqft | S$2,800,000 | S$1,885 psf |
Our estimate has been tested against 101 later sales at this project
One more figure sits behind everything above. As of 4Q2025, this site's estimate for Riverfront Residences was tested against 101 subsequent sales at the project. The median error came out at 2.3%, and 50% of those sales landed inside the stated range.
That is a backtest, not a promise about any single unit. It tells you how close the estimate has been on past recorded transactions here, and how often the actual price fell within the band we published. The other half fell outside it. Every figure in this piece comes from recorded caveats and rental approvals, and none of it is a formal valuation.
A few things this data pack does not settle. It cannot tell you whether the wider quartile spread in 2Q2026 reflects a change in which units are selling or a change in pricing within the same units. It cannot separate floor and facing inside the size bands. And the gap to the projects within 1 km is measured on medians that mix different unit types across different counts, from 10 resales at The Florida to 54 at Kingsford Waterbay. The next quarter's caveats will show whether the median holds near S$1,775 psf on another count in the thirties, and whether rental contracts keep sliding from the 89 recorded in 3Q2025.
We keep coming back to the same point with project-level numbers. One quarter's median is a single reading taken from a handful of transactions, and it moves for reasons the table itself cannot show. What gives it meaning is the company it keeps: the seven quarters before it, the district around it, the neighbours down the road, and the rents being signed at the same time. Read together, those tell you far more than the headline figure does on its own.
Method: URA resale caveats at the project (developer sales and sub-sales excluded) by the quarter of the sale month; size bands by caveated floor area; rents are URA rental contracts at the project, and the gross yield is the mean of the quarterly median rents per square foot, annualised, over the four-quarter resale median per square foot, before any cost. Lease left is the tenure less the years since the lease started, as recorded. The estimate accuracy is this site's backtest: the engine run as of the quarter named, compared with the sales since. Private figures are from URA Data Service caveats, HDB figures from data.gov.sg resale records, both loaded weekly by this site's ingest. Medians are of the non-excluded transactions in the period named; sales flagged by the hygiene rules (related-party transfers, bulk deals, outliers) are left out. Every figure is indicative and drawn from recorded transactions, not a formal valuation.